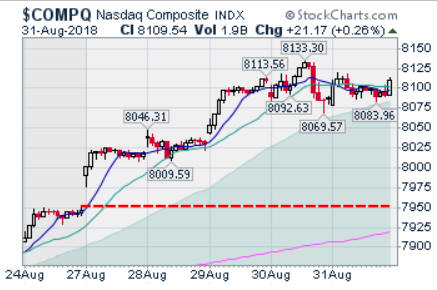
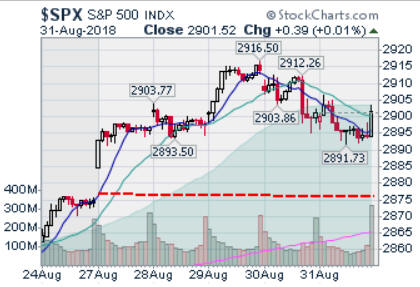
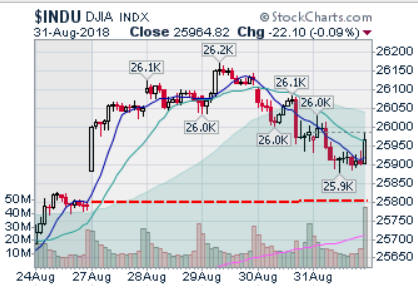
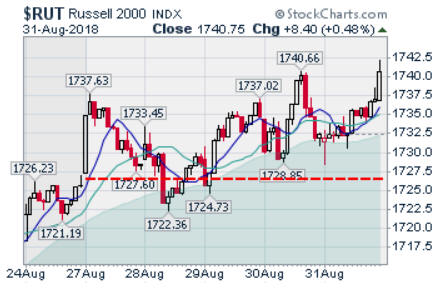
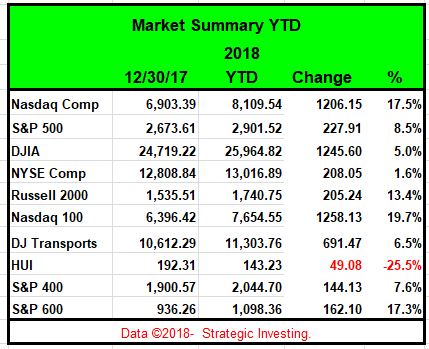
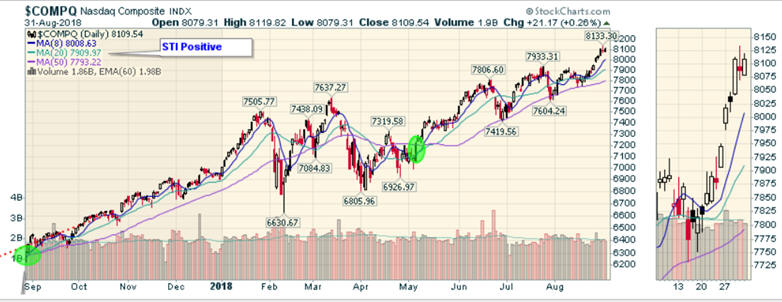
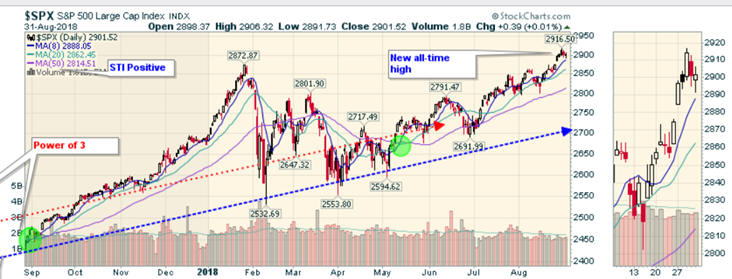
'Tis Only My Opinion!™September 2018 - Volume 38, Number 9110 Months ... and Counting?The long-term upward thrust of the market continues. The question is whether it will continue. Let us take a look at where the market and the economy is and then at what might be problems going forward. A Good WeekThe last week of August 2018 saw the market set a new all-time high for the NASDAQ. The major indices all managed to close in higher ground for the week o as seen below.
Friday's closing and year-to-date prices of selected indices are shown below:
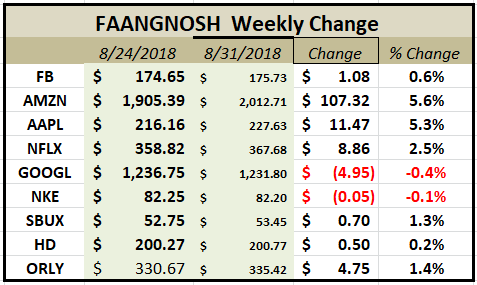
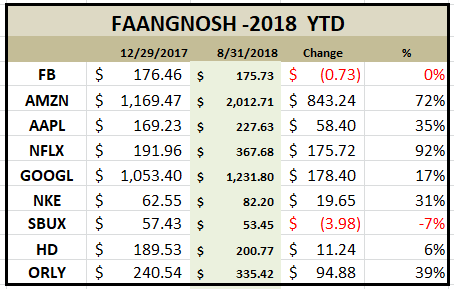
The FAANGNOSH StocksSo far this year, the FAANGNOSH stocks have performed very well as shown in the table below. For the year to date, only SBUX was really in the red while FB was nearly flat. NFLX was up 79% in the last 8 months.
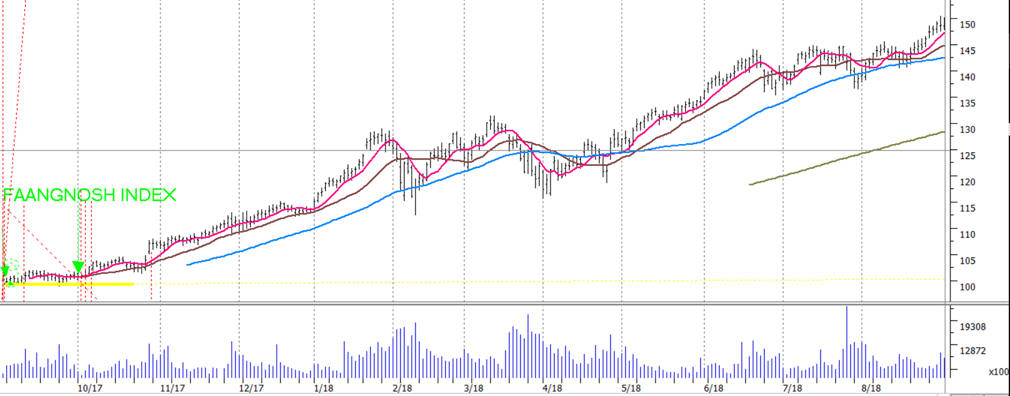
With the major indices making new record highs this week, the action of the FAANGNOSH stocks should not have been a surprise. The FAANGNOSH index is shown below.
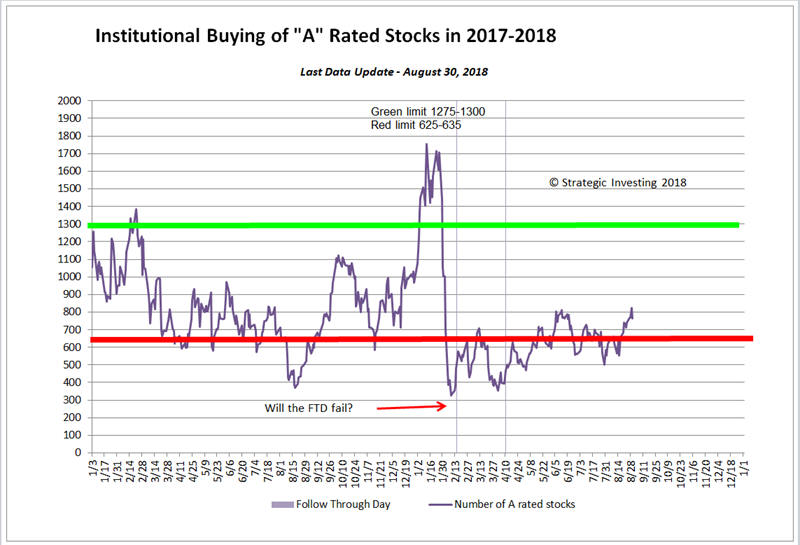
The question is why don't you have most of these stocks in your portfolio. The "A" Rated StocksDuring the past week, the "A" rated stocks gained ground but fell slightly on Thursday. However, the "A" rated stocks have not shown much strength in the last few weeks fluctuating around the red zone. One interpretation is that major institutions remain wary of this market and maybe selling stocks into the market.
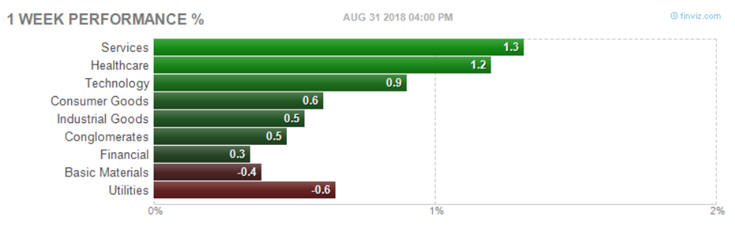
Group PerformanceGroup performance this week was mostly positive despite the performance of the basic materials and utility sectors as shown in the following chart courtesy of finviz.com.
The Simple Timing Indicator (STI) is positive.The Simple Timing Indicator (STI) for both the NASDAQ and the S&P 500 remains positive this week as shown below.
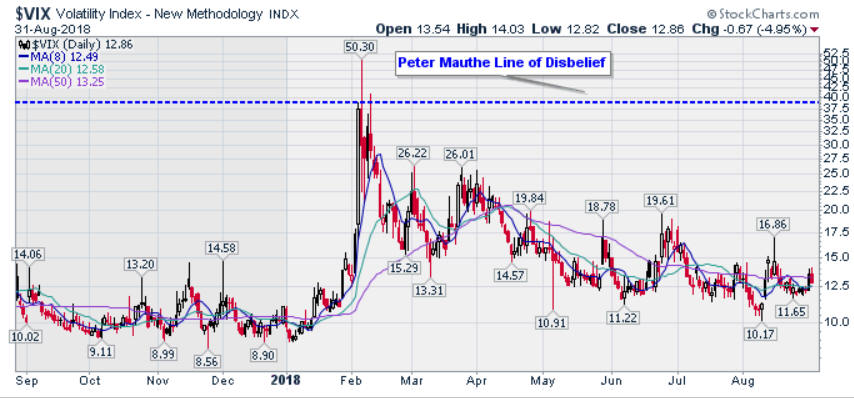
The VIX remains lowThe VIX continues to show little concern as seen in the following chart.
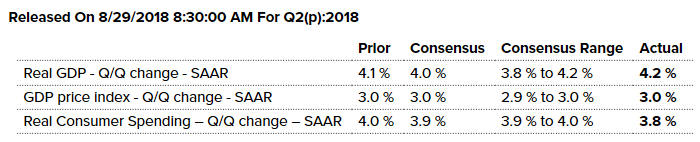
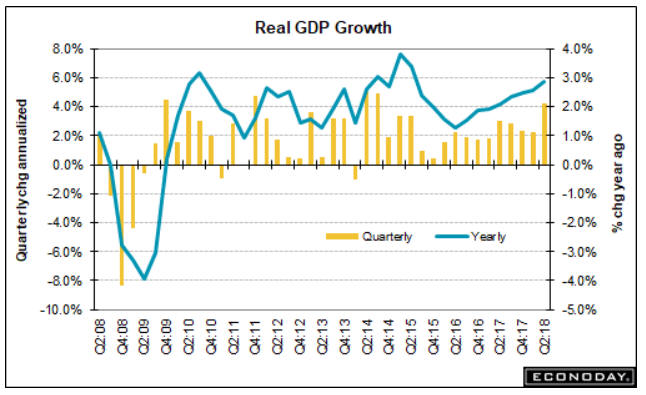
Economic NewsGross Domestic ProductMarkets were moved higher with the release of the GDP report for the 2nd quarter of 2018 showing a growth of 4.2% Strength in consumer spending was shaved slightly while contraction in residential investment deepened slightly, factors however outweighed by upward revisions to both nonresidential fixed investment and government purchases with revisions to inventories and net exports also slightly favorable. The net result is a 2 tenths upward revision to second-quarter GDP to a 4.2% annualized rate. Consumer spending is now at a 3.8% growth rate vs. 4.0% in the first estimate. Spending on both durables and non-durables was lowered, to a still enormously strong 8.6% for the former and to 3.7% for the latter, with spending on services unchanged at 3.1%. Residential investment was at minus 1.1% in the first estimate and is now at minus 1.6% in the second estimate. Nonresidential fixed investment gets a sizable 1.2% point upgrade to an enormously strong 8.5 % with components for equipment, now at 4.4%, and intellectual property, at 11.0%, both revised higher.
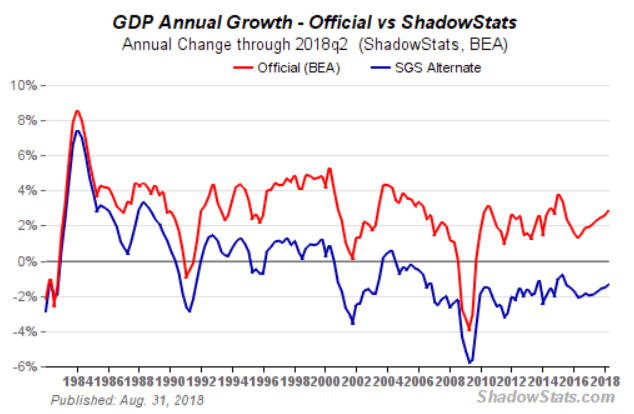
However, we need to reflect upon all the changes which have been and are being made in the calculation of GDP in order to make an informed decision. The SGS-Alternate GDP reflects the inflation-adjusted, or real, year-to-year GDP change, adjusted for distortions in government inflation usage and methodological changes that have resulted in a built-in upside bias to official reporting.
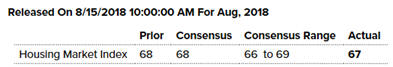
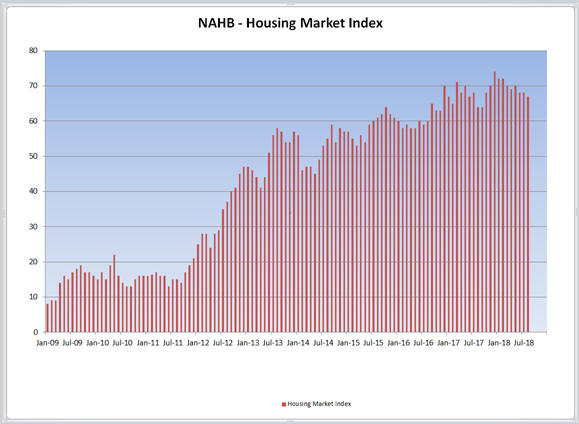
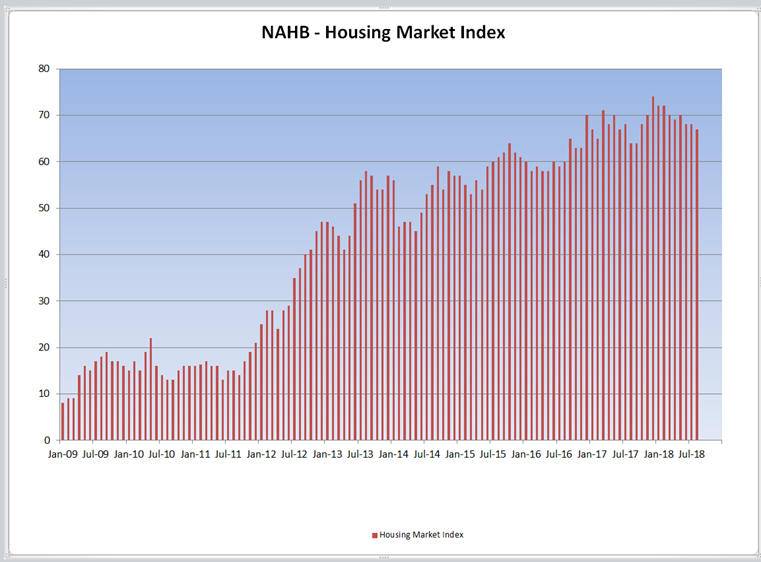
HousingThe Housing Market Index for August 2018
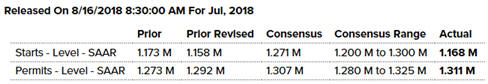
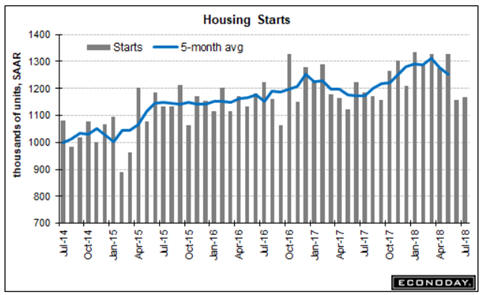
Housing Starts for July 2018 came in at 1.168 M homes or a slight increase from the revised level of June 2018. New building permits were reported at 1.311 M for July 2018 and were above the consensus estimate of 1.307 M.
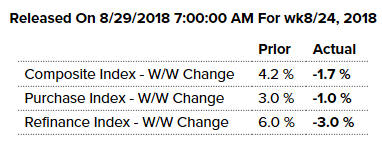
The Mortgage Bankers Association Mortgage Applications Composite Index was negative (-1.7%) in the week ending August 24th. The Purchase Index was lower (-6.0%). The Refinance Index also fell -3.0%. Interest rates moved lower, with the average rate on conforming 30-year fixed mortgages ($453,100 or less) down basis points to 4.78%.
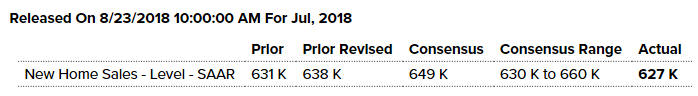
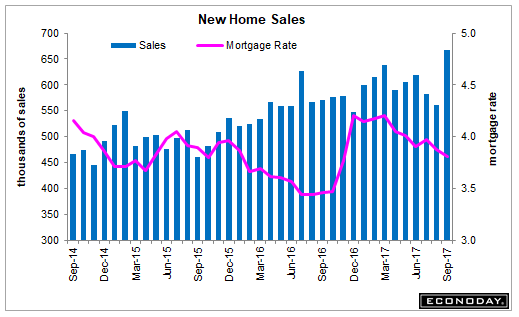
New Home Sales for July 2018 reported a decline from 631,000 to 627,000 homes.
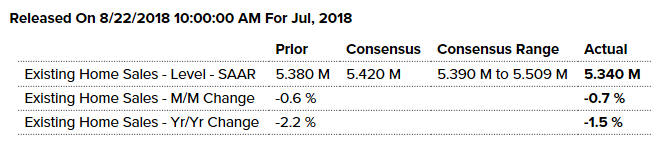
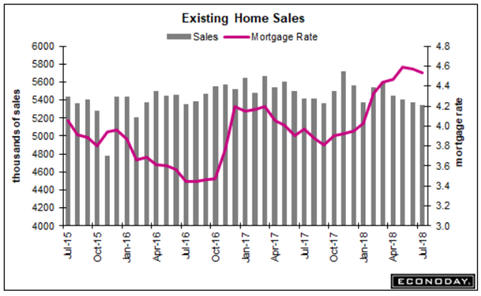
Existing Home Sales for July 2018 were under the consensus expectation and below June's 5.380 M level at 5.340 M or a decline of 0.7%.
The Housing Market Index for August 2018 fell to its lowest reading since September 2017 as rising construction costs held down builder confidence levels.
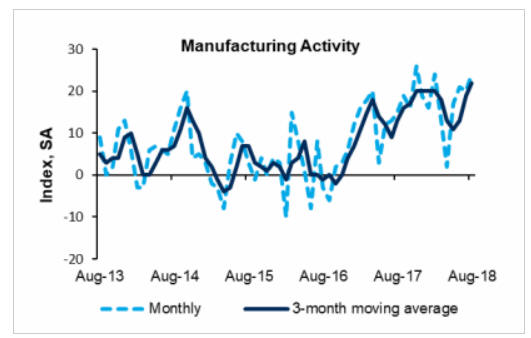
Manufacturing/ProductionThe Richmond Fed Manufacturing Index for August 2018 was strong rising from 20 to 24.
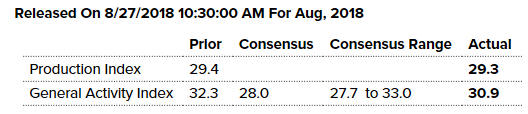
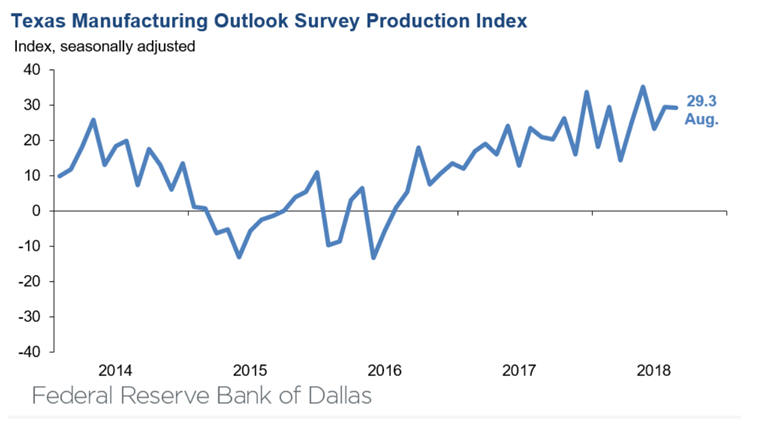
The Dallas Fed General Activity Index was lower in the August 2018 report. The production index, a key measure of state manufacturing conditions, held steady at 29.3.
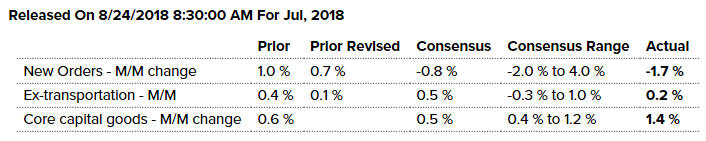
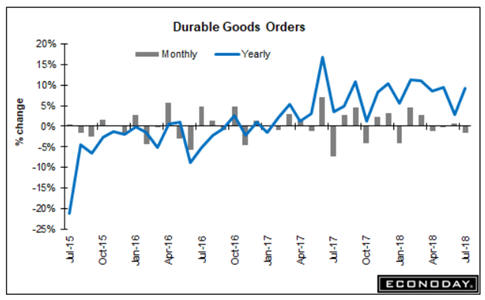
The Durable Goods report for July 2018 was affected by concerns over possible tariff levies and a decline in orders for airplanes..
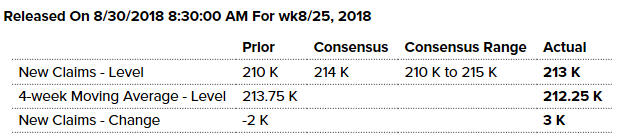
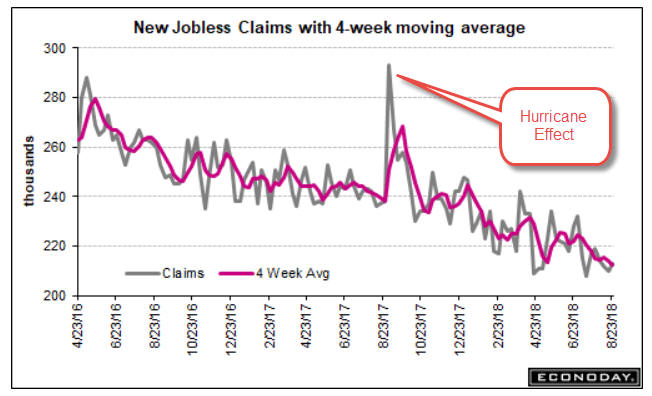
Employment & Jobless ClaimsNew Jobless Claims on a seasonally-adjusted basis for the week ending August 25th rose 3,000 to 213,000.
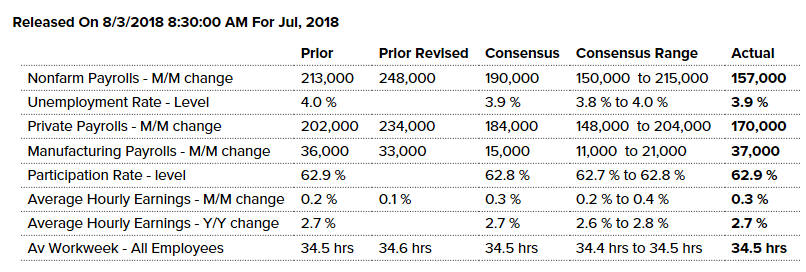
The July 2018 Employment Situation Report was touted by the politicians and bureaucrats as showing that the economy was near full-employment and that wages were increasing. However, only 157,000 new jobs were added to the non-farm payroll line of which 146,000 were added via the birth/death rate adjustment.
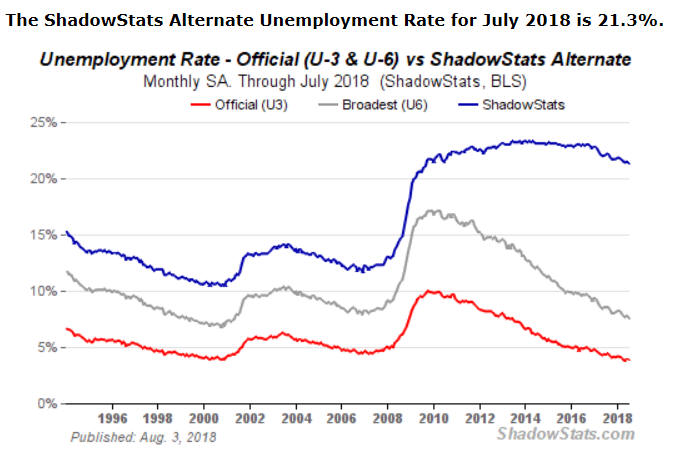
What is the real unemployment rate? John Williams analysis shows that the July 2018 rate is much higher at 21.3%. It is simply amazing what can be done by changing parameters and definitions.
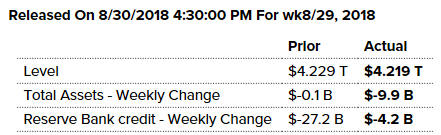
Financial NewsAccording to the H.4.1 report for the August 29th week, the Federal Reserve's Balance Sheet totaled $4.219 trillion in the August 29 week, down $9.9 billion from the prior week and down $241.5 billion from the beginning of balance sheet unwinding in October 2017. Treasury holdings were $2.325 trillion in the August 29 week, up $0.1 billion from the prior week and down $140.9 billion since October. Treasuries are scheduled to decline to $2.309 trillion by month end. Though the unwinding of mortgage-back securities (MBS) is significantly behind schedule, MBS holdings did decline $9.7 billion during the week to $1.697 trillion for a $71.2 billion decrease since October. MBS were scheduled to decline to $1.680 trillion at the end of July with $1.664 trillion the target for the end of August. Note that mortgage-backed unwinding can be uneven due to unscheduled prepayments of principal as well as timing differences in payments and settlements. The largest factor draining reserves in the week were MBS. Reserve Bank credit for the August 29 week decreased $4.2 billion after decreasing $27.2 billion in the prior week.
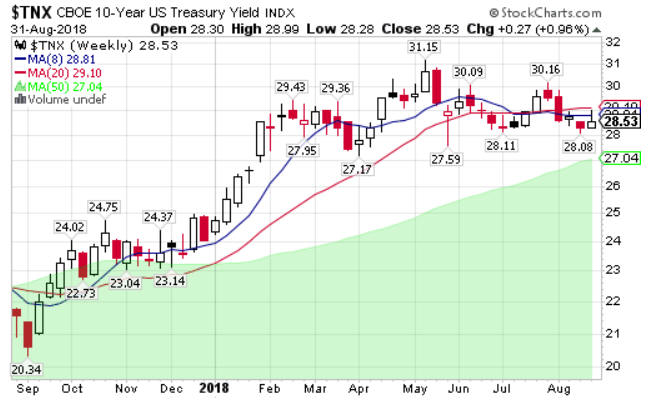
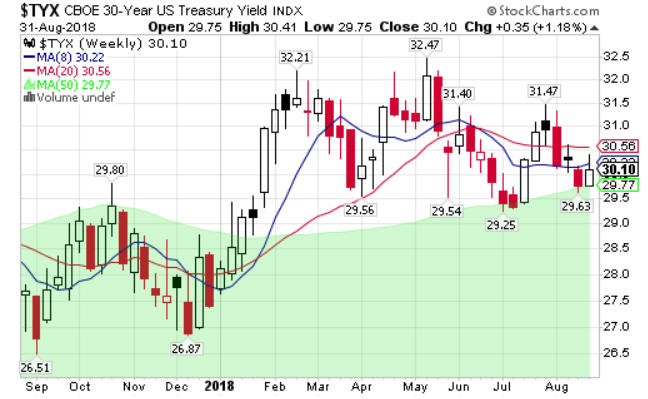
The yield on the 10-year U.S. Treasury note was higher closing the week at 2.853%. The 30-year U.S. Treasury bond also closed higher at 3.010%.
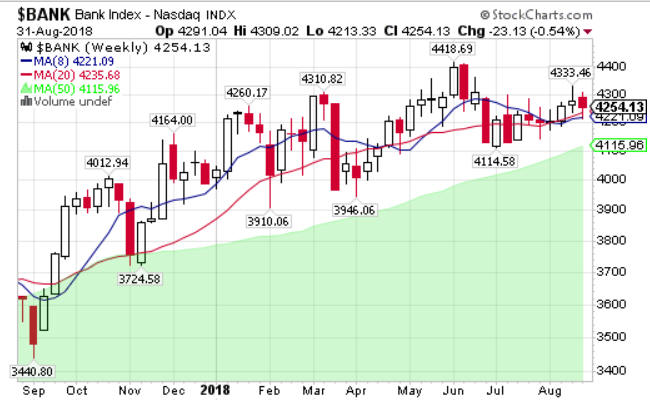
The Bank Index was under pressure thanks to the Jackson Hole meetings and the anticipation of another rate hike by the FED probably at the next FED meeting.
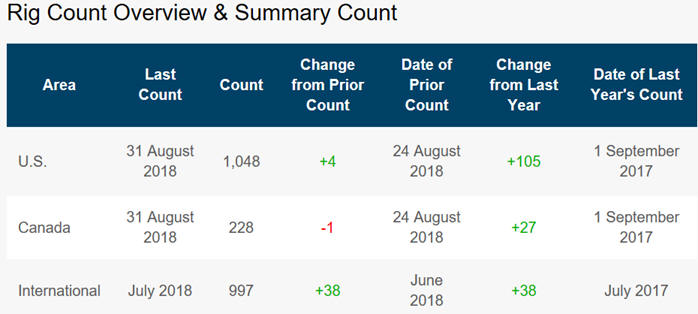
Energy SectorThe Baker Hughes North American rig count for the week ending August 31st is shown in the following table.
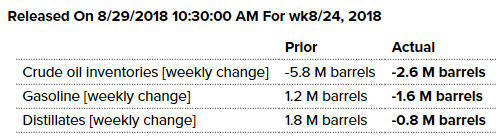
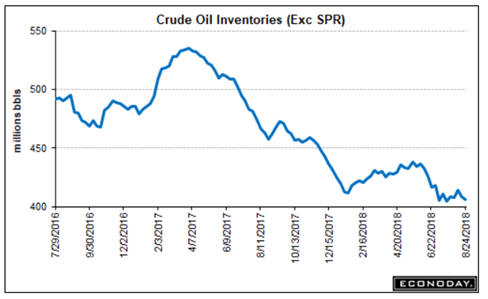
Crude Oil Inventories fell 2.6 million barrels in the August 24 week to 405.8 million, 11.4 percent below their level a year ago. Product inventories also declined, with gasoline down 1.6 million barrels to 232.8 million, 1.2 percent above the year ago level, and distillates down 0.8 million barrels to 130.0 million, down 12.8 percent year-on-year.
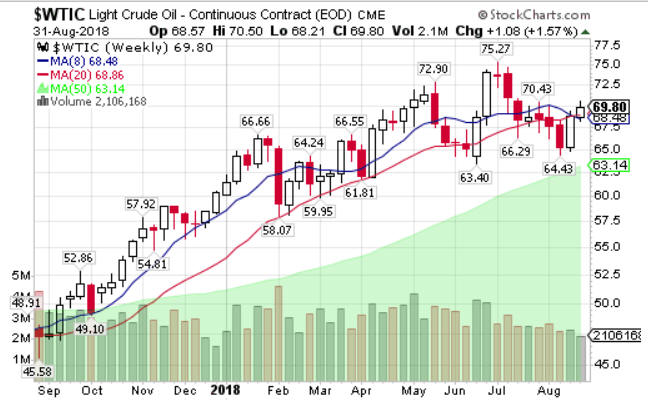
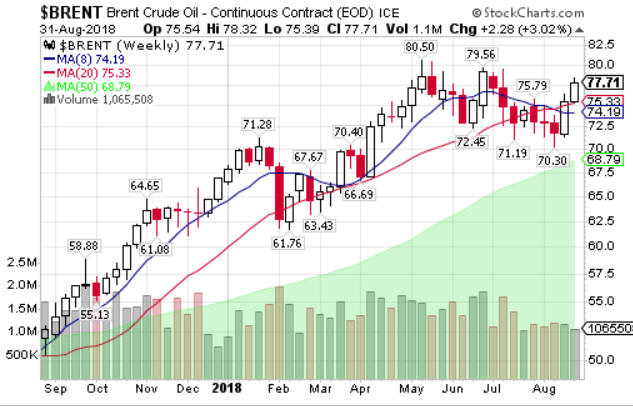
West Texas Intermediate Crude (WTIC) continued to rebound and ended the week at $69.80/bbl. Brent crude also closed higher this week at $77.71/bbl. this week increasing the differential between the two benchmarks.
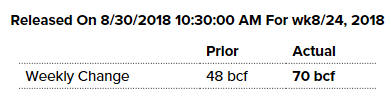
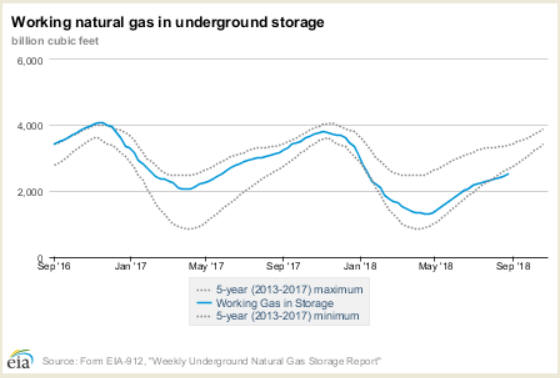
Natural Gas in storage rose 70 billion cubic feet in the August 24 week to 2,505 bcf. The eighteenth consecutive weekly build of the injection season was larger than the 30 bcf increase registered last year at this time and exceeded the 65 bcf average build in the comparable week over the last 5 years. Gas stocks were 20.5 percent below their level a year ago and 19.0 percent below the 5-year average for the period. For the fifth week in a row, gas stocks were also below the 5-year historical range for this time of year.
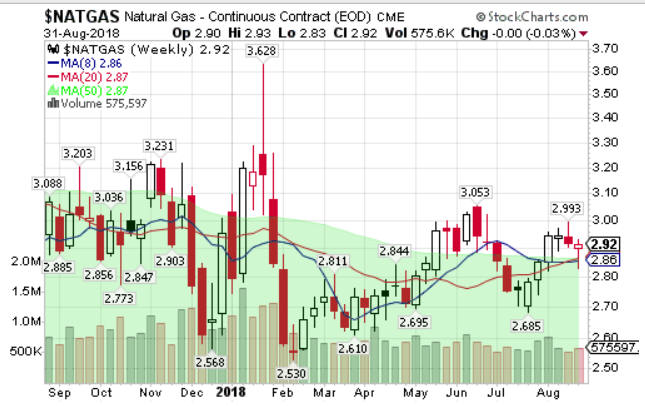
Natural Gas closed the week at $2.96/mmcf up 5 cents on the week.
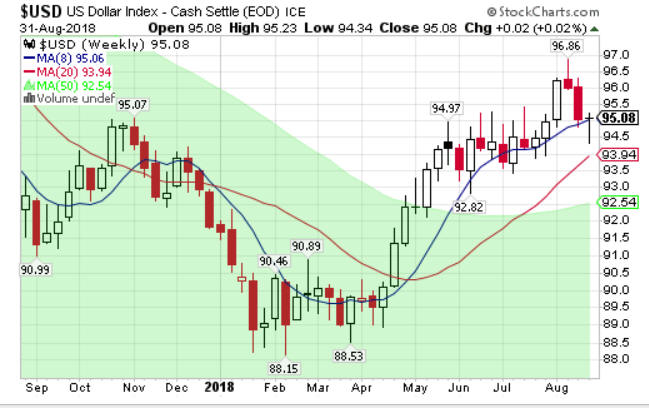
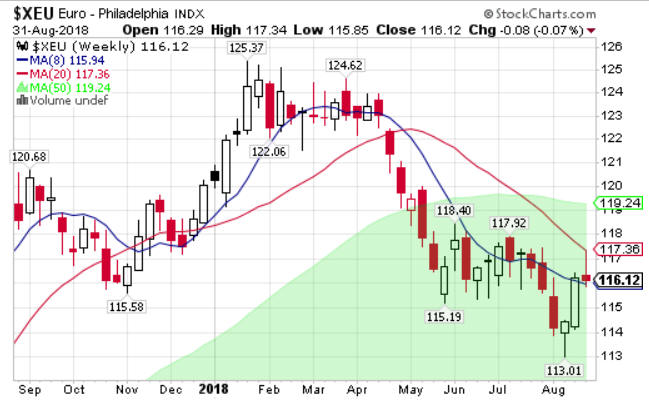
FinancialsThe U.S. Dollar Index continued under pressure closing this week at 95.08. The Euro (XEU) managed to close lower on the week at 116.12.
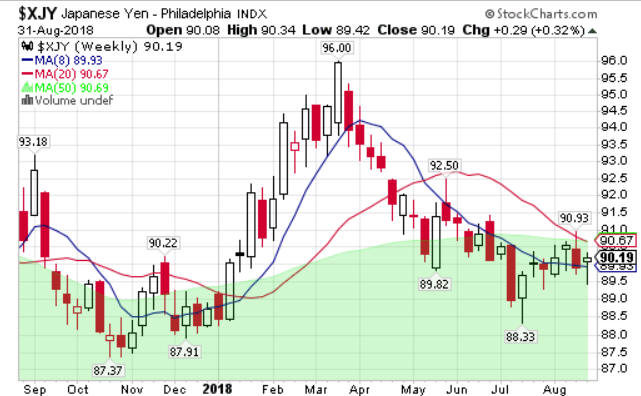
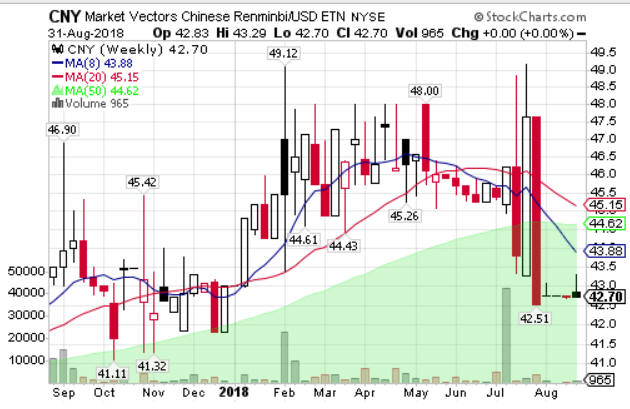
The Japanese yen lost ground this past week closing at 87.97. The Market Vectors Chinese Renminbi/USD was up slightly during the week closing higher at 42.70.
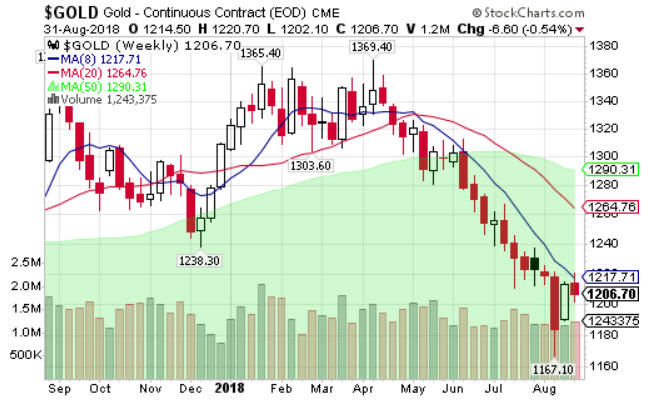
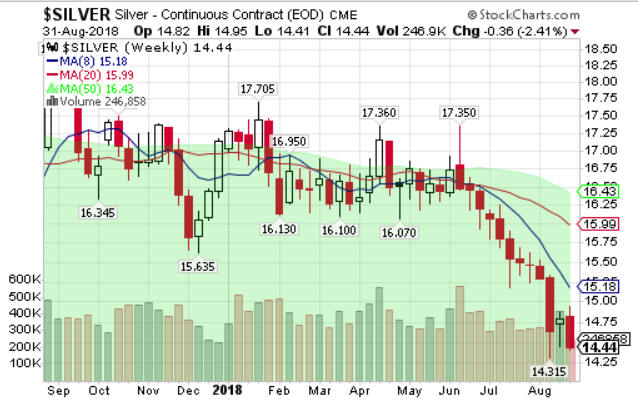
Gold closed lower on the week at $1,206.70/oz. Silver was also under pressure during the week closing at $14.44 per ounce.
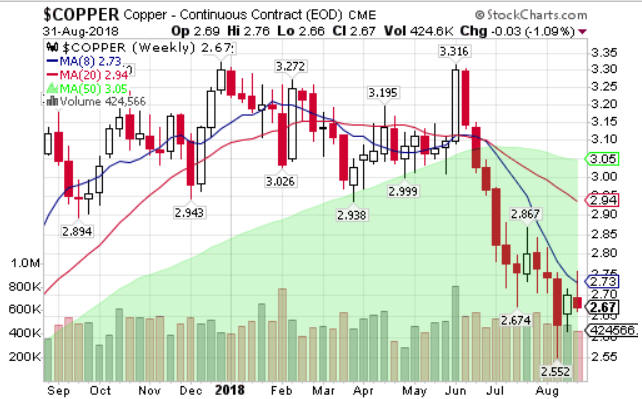
Copper also ended lower on the week closing at $2.67 per lb.
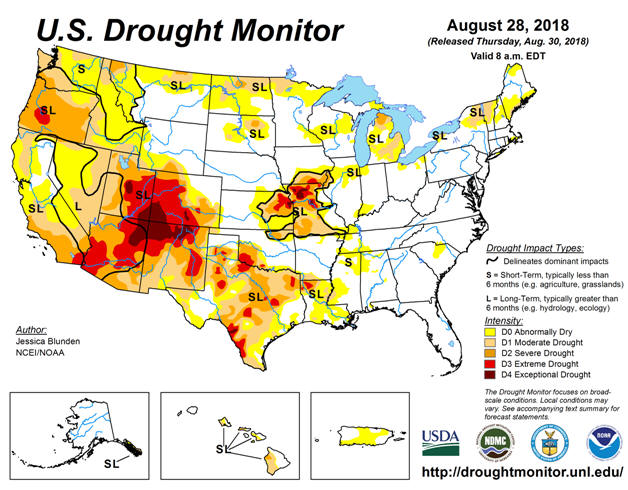
Agricultural SectorThe U.S. Drought Monitor continues to deteriorate. Frontal systems brought thunderstorms and some heavy rainfall to parts of the Plains, the Midwest, and the South. While rainfall was enough to reduce or alleviate drought conditions in some places, such as Arkansas, northern Missouri, Kansas, Wisconsin, and Michigan, it wasn’t enough in other areas, such as southwestern Missouri and Idaho, as deficits and impacts remain. This past week saw temperatures slightly below average across much of the nation, with areas of eastern Montana and western North Dakota 4-8 degrees F cooler than normal, which helped to slow, but not halt, drought development. Conversely, parts of the Southwest, Texas, and areas along the eastern northern tier of the U.S. were well above their average temperatures. In Texas, notably, the widespread heat exacerbated evolving and ongoing drought.
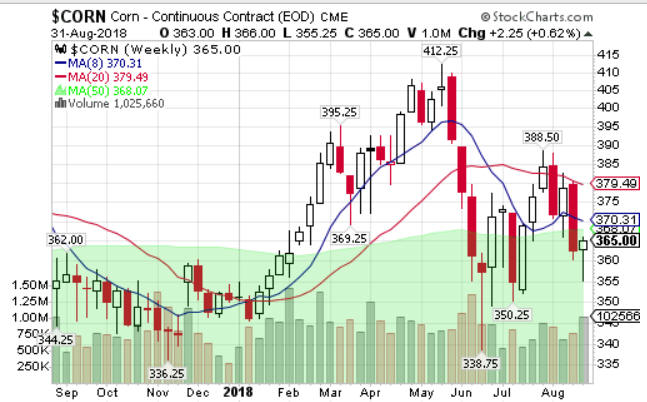
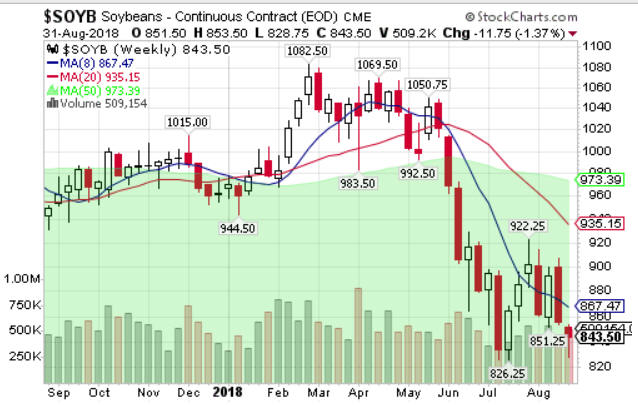
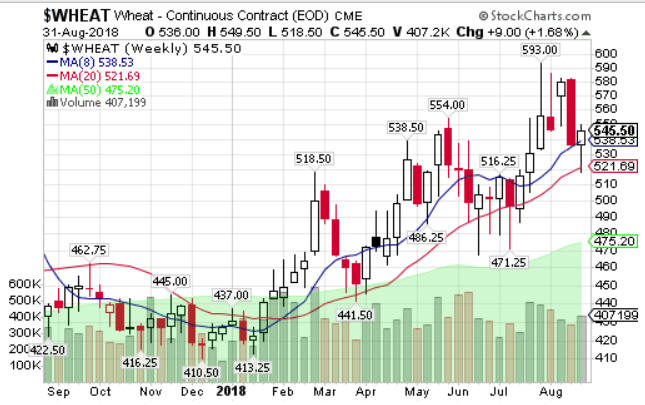
Corn ($3.65/bu) rallied to close slightly higher after bouncing off a low of $3.55 this week. Soybeans ($8.435/bu) continued to fall during the week. Wheat ($5.45/bu.) bounced higher during the week.
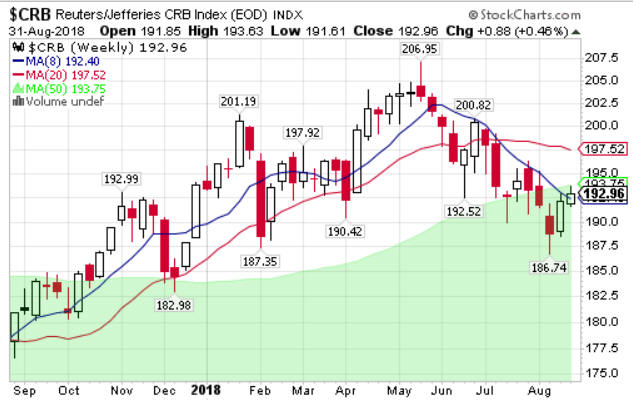
The CRB index was higher for the second straight week closing at 192.96 this week.
Issues that might create problems for investors going forward.Here are some of the issues that could create problems for the market going forward.
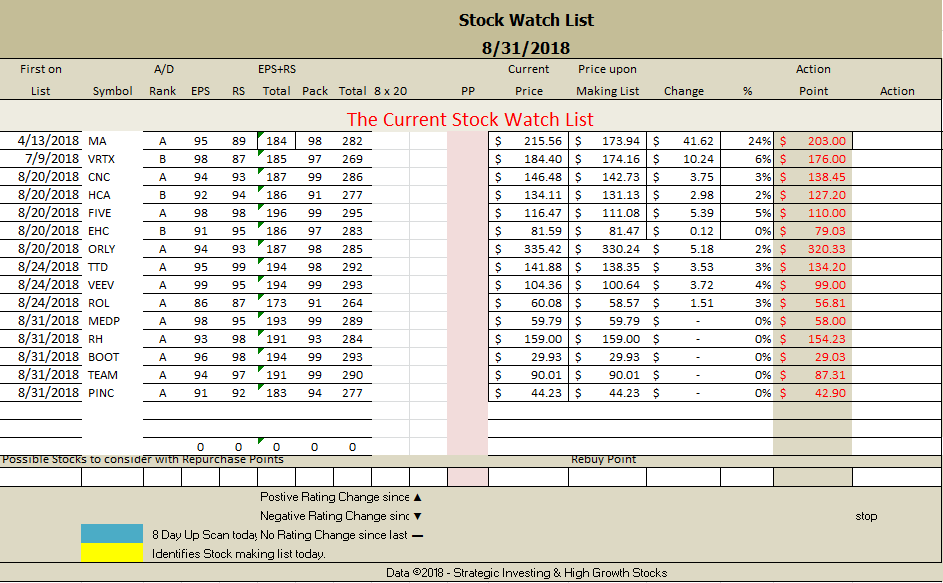
Strategic Investing Stock Watch List
Remember to: Keep It Safe, Simple and Stay Focused! But then 'Tis Only My Opinion! Fred Richards www.adrich.com Corruptisima republica plurimae leges. [The more corrupt a republic, the more laws.] -- Tacitus, Annals III 27 'Tis only My Opinion! Archive Menu, click here. This
issue of 'Tis Only My Opinion was copyrighted by Strategic Investing in 2018. |