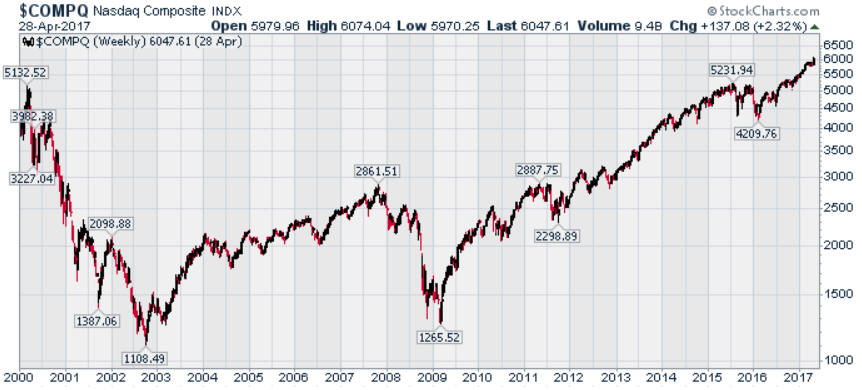
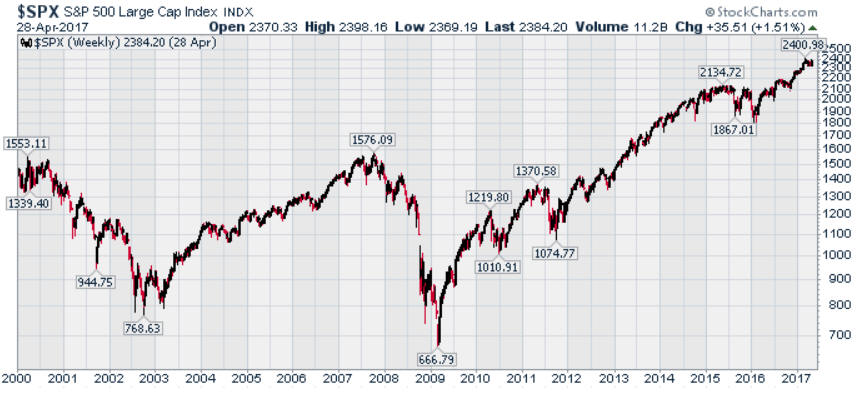
'Tis Only My Opinion!™May 2017 - Volume 37, Number 5"Sell in May and Go Away "The old adage has many advocates. Of course, with the market indices now at or near all-time record highs and the current upward movement over 93 months in duration, one wonders how much longer this market uplift can continue. The following weekly charts show the NASDAQ composite index and the S&P 500 index since January 3rd, 2000.
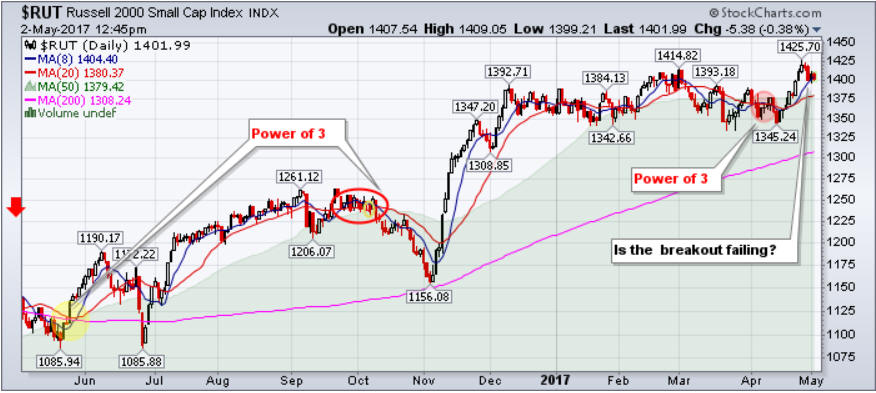
During the past 30 months, the Russell 2000 has been the best indicator of future trend shifts in my opinion as seen in the daily chart for the past twelve months.
As seen in the above chart, the Russell developed a "Power of 3" condition in early April and then broke out to the upside. However, during the past week, the Russell 2000 has retreated and is now at the 8-day moving average. A failure to bounce higher and take out the 1,425.70 level from last week would be a concern. Hard versus Soft DataThe Ministry of Truth's data is what the mainstream media and many market analysts tout as being fact. As a result, the economy is seen as moving forward as follows:
John Williams of ShadowStats.com does an analysis of the same data without all of the Ministry of Truth's adjustments .
In the examples shown above, there would seem to be significant differences between the Ministry of Truth's data and that of ShadowStats.com. Will the Trump effect continue?As has been shown in many previous 'Opinion articles, there is a significant difference between perceived results and actual results. The latest upward push in the market began in November 2016 upon the election of Donald J. Trump. The following chart shows the gains in various indices.
Conclusion ...With most portfolios showing a significant gain since either the lows of 2009 or the beginning of the Trump effect from November 2016, it would be prudent to expect that with a divergence between hard and soft data growing that investors might want to consider stepping back from the market. Until Congress can pass both a healthcare bill and a tax bill, there would seem to be enough uncertainty in the market coupled with all the other external distractions in Europe, the Middle East and North Korea to make "Sell in May and Go Away" a very thought-provoking option. But then - 'Tis Only My Opinion!Fred Richards www.adrich.com Corruptisima republica plurimae leges. [The more corrupt a republic, the more laws.] -- Tacitus, Annals III 27 'Tis only My Opinion! Archive Menu, click here. This
issue of 'Tis Only My Opinion was copyrighted by Strategic Investing in 2017.
| |