'Tis Only My Opinion!™
March 2015 - Volume 35, Number 3
"What is the
Market Really Saying"
During February 2015, many of the major stock market
indices closed at new record highs. Investors appear not to be
concerned with the current economic status but rather are hopeful
that the Obama administration will be able to deliver on its
economic promises.
It would appear to me as if investors believe that everything is
going well. However, it is possible that they are sitting in the
eye of a major hurricane ignoring the fact that their world will
crumble in the upcoming storm.
The Economy
The economy continues to struggle. For example, during February 2015
there were an large number of economic data points that failed to
meet the expectations of economists and other soothsayers. For
example, of 26 series available only four of those series exceeded
expectations during the first part of February.
The misses were:
- Personal Spending
- Construction Spending
- ISM New York
- Factory Orders
- Domestic Vehicle Sales
- ADP Employment
- Challenger Job Cuts
- Initial Jobless Claims
- Non Farm Productivity
- Trade Balance
- Unemployment Rate
- Labor Market Conditions
- NFIB Small Business Optimism
- Wholesale Inventories
- IBD Economic Optimism
- Mortgage Applications
- Retail Sales
- Bloomberg Consumer Comfort
- Business Inventories
- Michigan Consumer Sentiment
- Empire Manufacturing index
- Housing Starts
- Building Permits
- Producer Price Index
- Industrial Production
- Capacity Utilization
- Manufacturing Production
Those beating forecasts were:
- Personal Income
- Markit Services PMI
- Nonfarm payrolls
- JOLTS
As the consumer accounts for about 65 to 70% of the
economy, retail sales growth, or lack thereof, is an important series
to monitor. However, as a following graph shows the growth of monthly
sales in the last two months has been negative.
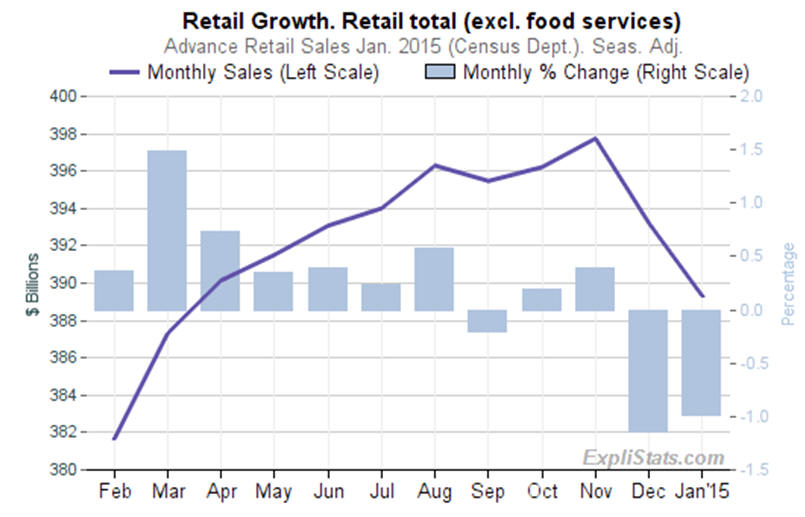
The decline in this retail sales series should be troubling to
the Federal Reserve economists that insist that the economy is
improving.
As we previously discussed in 'Tis Only My Opinion!
articles, the Ministry of Truth's reports often fail to present a
picture of the real world.
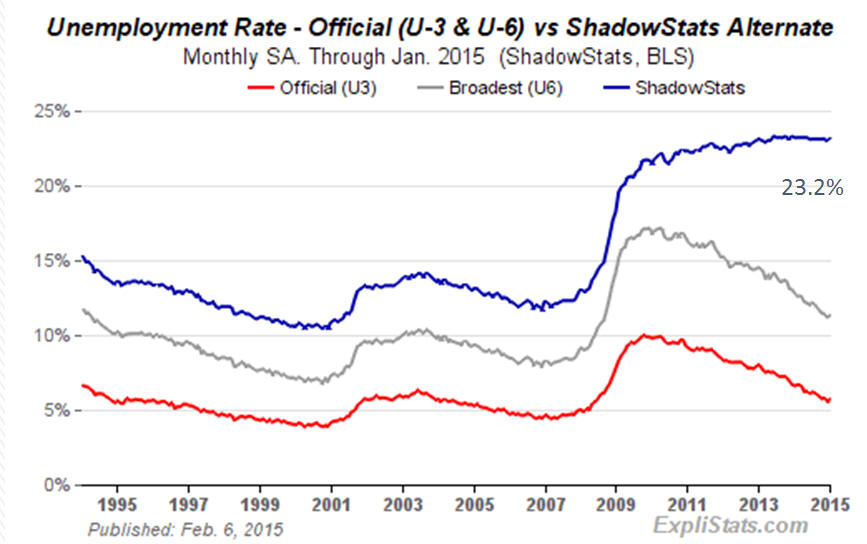
For example the Bureau of Labor Statistics Unemployment Rate for
January 2015 showed a slight increase to 5.7%. This is
the U3 data series which is the headline number daily reported by a
subservient news media.
Jim Clifton, the President of Gallup, recently commented that
"the unemployment numbers are a big lie." Unfortunately, he
was comparing the U-3 and using the U-6 data to make his comment.
What is amazing to me is that Clifton did not know the fallacies in both
of those series! Or more importantly, the fact that there is little
comparison to today's methodology relative to the way we counted
unemployment prior to 1940.
The U6 series takes into account other factors including those
who been out of work for less than one year and currently is
reported at 11.3%.
John Williams of Shadow Government Statistics
uses methodology counting all people that are looking for
work irrespective of how long they've been out of work and he
concludes that the real unemployment rate is about 23.2%.
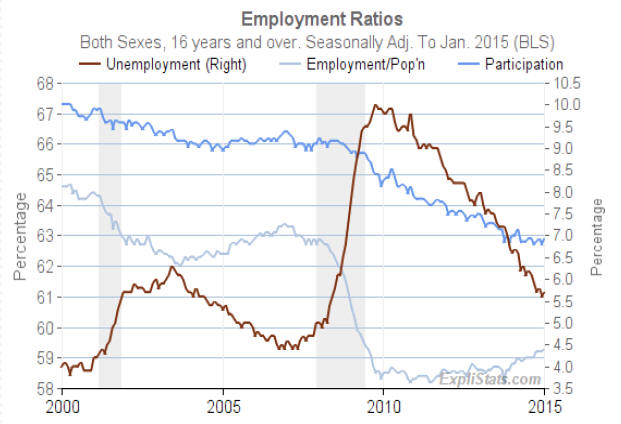
When measuring unemployment there are several parameters which
are useful. The following graph shows the U3 unemployment rate since
2000 as well as the unemployment to population and the participation
rate graphs. The participation rate has continued to fall
since 2000 despite the fact that the unemployment rate has fallen from
a rate of 10% to 5.7% in the same period.
Unions and politicians are currently pushing for a major increase
in the minimum wage ignoring the real dangers of forcing many
industries to increase the use of robotics which will lessen the
demand for entry level workers.
As I have repeatedly pointed out, one of the biggest problems
facing the world is finding meaningful jobs for the workforce so
that the populace does not turn to revolutionary uprisings.
It is simply amazing to me that many politicians and progressive
activists fail to understand the relationship between costs and
revenue in a capitalistic society. However, for a progressive, these
factors are not important. Hence, the economy gets blindsided by the
"law of unintended consequences" over and over.
Further, when decisions are made based upon erroneous data, the
policy decision is often wrong.
A perfect example is the reporting of the Consumer Price
Index (CPI). Prior to June 1996, the methodology used to calculate the consumer
price index was changed three times. Since that date, the
methodology for calculating the consumer price index has been
changed 22 times. Moreover, in every case, in the month in which the
change was made the result was a reduction to the reported consumer price
index.
Hence, what is being compared when calculating the consumer
price index is simply "apples and oranges."
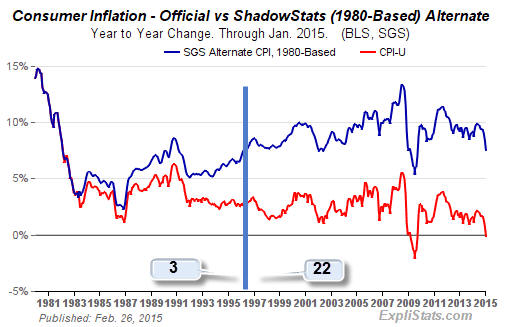
John Williams of Shadow Government Statistics (SGS) using the
methodology used in 1980 estimates that the consumer price index is
really running around 9% on a yearly basis.
The Chapwood Index which
monitors actual prices in 40 major metropolitan areas shows a range
of price differences as of December 2014 of between 8 to 13%.
The question is simply this:
Why does the BLS analysis of consumer inflation differ by an
order of several magnitudes from other studies?
Gross Domestic Product (GDP) is another series often modified "to
reflect the changing nature of the economy." As a result, we
can find a major disconnect between the Ministry of Truth's
calculation and a series based upon the definition used in 1980 as
calculated by SGS and others.
According to the SGS series the U.S. GDP has been in recession since the third quarter of 2004
and before the financial melt-down of 2007 - 2008.
The two series were closely coordinated up until 1991 when the
divergence became significant. Under the Obama administration, the
gap has widened particularly with the recent modifications to the
GDP calculation.
The Markets
When looking at the stock market, is always important to remember
that price levels are basically a guess on future economic prospects. One of
the most important lessons from my mentor was simply this:
Sell the expectation, not the result!
Today, the major indices sit at, or near, all-time highs on a nominal basis as shown in the following charts
for the NASDAQ, the S&P 500, the
Russell 2000 and the Dow Jones Industrial
Average (DJIA).
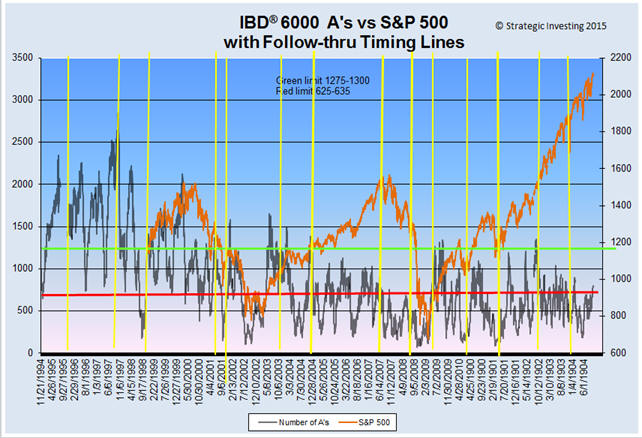
It is generally believed that institutions and large hedge funds
are the driving force behind the markets. However, since 2000,
the dominant force in the market has been the central banks, in
particular, the Federal Reserve Bank with its quantitative easing
programs. The Federal Reserve in conjunction with the Working Group
on Capital Markets, otherwise known as the Plunge Protection Team
(PPT), have interceded in the markets routinely since the financial
meltdown of 2007-2008.
The following chart of the number of stocks classified as being
under significant accumulation shows a significant reduction in
recent years.
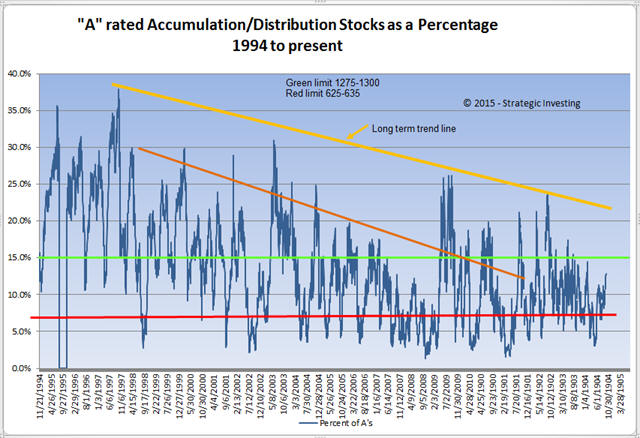
Since 2014, institutional buying has been relatively
subdued yet the markets have continued to rise. Since 2008, about
70% of all profits of the S&P 500 have been used to provide
dividends or for stock-buybacks. In other words, innovation in
R&D is shrinking and the U.S. is consuming its "seed-corn."
The S&P 500 index shows the disconnect since
2002.
Despite the length of the current market rally which is the
second longest in history, investors and institutional portfolio
managers do not seem to be concerned as
the VIX remains near historic low levels. Perhaps,
they are convinced that the Bernake "put" is now the Yellen "put".
How often has the "buy the dips" theory led to profits during
the past eight years? Corrections have been halted amazingly before
they break the 10% correction point and suddenly regain the previous
highs. I doubt if it is just coincidence.
The Currencies
During the past six months, there has been a lot of ink used with
various "experts" pointing out that a currency war is underway as
central banks try to use currency devaluation as a means to arrest
the economic decline. The strategy of low interest rates,
devaluation of currencies and quantitative easing has failed to
improve growth prospects.
In the U.S. after blowing up the Federal Reserve's balance
sheet by almost $4 trillion, the economy has not returned to full
employment and the jury-rigged GDP is not keeping pace with
inflation levels as measured by SGS or the Chapwood index. The
Eurozone and Japan have had similiar results.
The Baltic Dry Index (BDI) is at historic low levels
as seen in the following chart. The collapse in the BDI since
October 2014 is simply amazing and coincides with the decline in the
price of crude oil. It serves as a proxy for international economic
growth.
The U.S. dollar index has improved its relative
position as shown in the following chart. However, in my opinion, it
is simply the case of its "safe-haven status" and the fact that the
U.S. economy is thought to be "muddling-through" as it
"jiggles" its economic reports whereas most of the rest of the
world is in a deepening recession.
In contrast, the Euro while fighting the
problem of a Greek potential exit from the Eurozone as well as weak
economies in Spain, Portugal and Italy has fallen to new 9-year lows
as shown in the following chart.
Japan which is doubling down on its QE bet also looks weak. The
yen is sitting at the 82 support/resistance level
and a break could see the yen move lower.
The Canadian dollar has been acting poorly in
the last quarter but seems to have found a bid near its 79
support/resistance level.
The Commodities
During the past eight months, the price of crude oil as measured
by either Brent crude or West Texas
Intermediate crude (WTIC) has fallen off a cliff.
However, in recent weeks, it appears to be attempting to build a
base from which to move higher.
There maybe many reasons for the decline in the price of crude
oil. However, the reduction in the price of energy has not
made a major impact on the U.S. economy nor has it lifted the
Eurozone out of its financial and economic problems.
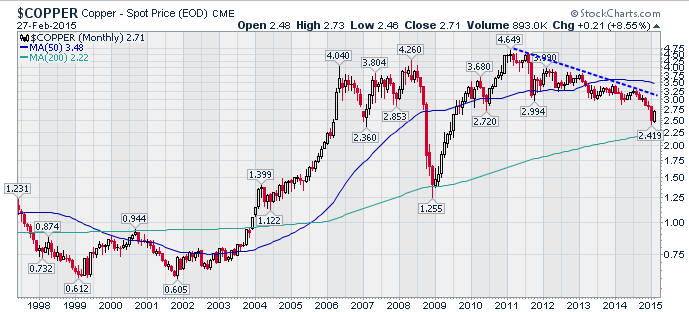
Many years ago, my old mentors used to say ... watch copper for
it foretells the future of the economy.
Copper as shown in the
following chart does not exactly suggest a rebound in economic
growth. Perhaps, it is attempting to rebound but problems
remain in China ... a major consumer of the metal. The
discovery of fiduciary warehouse problems in China as well as a
downturn in consumption have led to reductions in mine output by
major suppliers. It is expected that the growth rate of housing in
China will be slowing considerably in the next few years which
should reduce demand. Also, China is at the forefront of
replacing copper as a transmission line for high-voltage
applications.
The Hard Species
Throughout history, gold and silver have served as storehouses of
wealth. Governments have attempted to use various methods including
"shaving" which lead to the edges on coins to enable them to
continue to live beyond their means. With the Nixon decision to
abandon the gold standard, governments were able to expand the use
of fiat currency while hoping that runaway inflation could be kept
under control.
However, Keynesian economists have dominated the central banks.
In the U.S., an inflation guideline of at least two percent was used
by the central bankers knowing that
"shaving" through inflation would amount to an added tax, or theft,
of the country's wealth that amounted to at least 18% per decade.
The ability to manipulate the price of gold and silver through
the use of ETF's was a brilliant stroke. As a result, there has
become a disconnect between the price of paper gold and actual gold
for immediate delivery. In fact, many of the contracts are no
longer settled by delivery of physical but in cash of the commodity
exchange.
The price of gold and silver according to the CME is shown
in the following charts.
The clamor for an investigation in the rigging of the gold and
silver price is now gaining traction. The fact that the price
of gold rarely exceeded a 2% daily upward move should have been a
major concern to any governmental agency worried about the fairness
of markets.
The recent request by Germany to have its gold returned from the
U.S. shows that something is not well in Denmark. The question
is whether any of the German gold is actually physically held in the U.S. gold
depositories, Perhaps, most of it has been leased out to bullion
banks at substantially lower prices and has gone to the East. It is
really not a question that Chairwoman Yellen of the Federal Reserve
is willing to answer through an audit.
Debt & Unfunded Liabilities ... the Achilles heel!
Since the beginning of the financial melt-down in 2007, the
central banks have been fighting a battle of insolvency with
liquidity. Of course, they are just kicking the can down the
road .... hoping that the world won't collapse on their watch.
In the U.S., the Obama Administration takes credit for reducing
the federal cash deficit by simply failing to recognize in its accounting expenditures
outside the federal budget. For example, if, in FY 2014, the U.S.
Treasury
reported a cash deficit of $483 billion ... why did the federal
stated cash debt rise by $1.1 trillion?
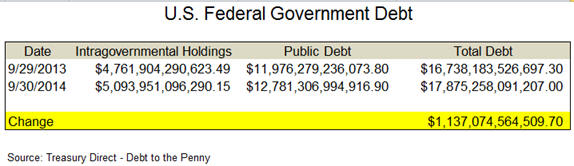
The answer is that a lot of government agency debt is held
off-the-books, although, it is guaranteed by the U.S. taxpayer.
The real problem, however, lies in the unfunded liabilities that
arises from social security, disability insurance, governmental
pensions, and Medicare/Medicaid to mention just a few. As of
FY 2013, the total debt and unfunded liabilities was estimated to be
$92.3 trillion ... a sum that simply can not be paid. Of
course, that is pure speculation since 3 of the 5 largest sectors of
the government could not be given a clean bill of health.
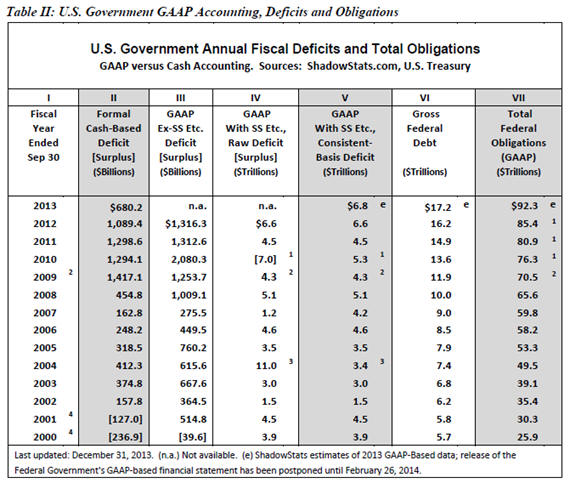
The report for FY 2014 will be released shortly and with the
costs of Obamacare rising, it will probably rise to the $110
trillion level.
Conclusion
So what is the market really saying?
First, traders and investors are swayed by emotion and are
affected by knee-jerk reactions, technical chart reading and rarely,
consider the real facts surrounding the economy and companies.
This disconnect will continue until the emperor
is seen to be without clothes as a major black swan event plunges
the market well beyond the safety limits built into the Algo
programs.
Second, when that happens, all bets are off.
But then - 'Tis Only My Opinion!
Fred Richards
February 28, 2015
www.adrich.com
www.strategicinvesting.com
Corruptisima republica plurimae leges. [The
more corrupt a republic, the more laws.] -- Tacitus, Annals III 27
This
issue of 'Tis Only My Opinion was copyrighted by Strategic Investing in 2014.
All rights reserved. Quotation with attribution is encouraged.
'Tis Only My Opinion is intended to provoke thinking, then dialogue among our
readers.
'Tis Only My Opinion! Archive Menu
Last updated - December 31, 2014
|