The outlook for 2012 is not rosy for either the U.S. or the world economy. The world will be affected by two major obstacles to growth ... debt and demographics. The combination of these two will combine to render ineffective any political solution to a world economy that is on the brink of a world-wide financial upheaval.
The world remains in the throes of a major deleveraging cycle. There is simply too much debt at all levels, sovereign, corporate and individual. Moreover, the debt for sovereign nations has become skewed to the short-end of the maturity schedule. As the world economy deleverages, the risk to the world economy can be seen in the following illustration.
In an attempt to revitalize a banking system that was leveraged to the hilt, the BASEL III accords added capital requirements to the financial system which further reduced the available funds required for commerce.
Politicians and their minions, the bureaucrats in central banks, developed programs that address liquidity and not insolvency of major financial institutions.
Politicians in order to prevent massive bank failures forced the accounting profession to change FASB 157 from "mark-to-market" to "mark-to-make believe" accounting rules.
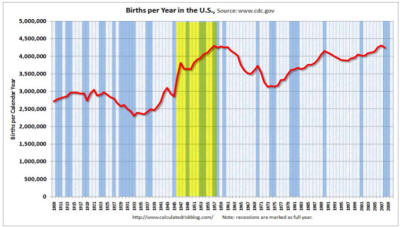
Demographics are a major problem throughout the world. In 2011 worldwide population rose to in excess of seven billion people. The birthrate in the developed countries is hardly sufficient to maintain their populations and liberal immigration policies in Europe are in the process of transforming their civilizations from a Judeo/Christian society to one that will be dominated by Islamic traditions unless immediate steps are taken.
Birthrates in the undeveloped countries are soaring and will result in major problems within the next 30 years.
The world economy is facing a major task in finding enough meaningful and productive jobs for these individuals.
However, increasing productivity serves only to reduce jobs. In the United States, in the current economic environment, unemployed individuals over the age of 55 will find that their unemployment may be permanent if they do not have a specific skill set which is required by an employer.
The increasing use of robotics in productive enterprises not only decreases labor costs but reduces the number of jobs. Within the next few years most jobs involving repetitive movements will be handled by robots. It is my opinion that the biggest changes in manufacturing during this decade will be the move to robotics in the manufacturing process. As a result, labor inputs will no longer be a major cost factor for many industries.
This will affect the undeveloped countries as well as the developed countries. The advantage of low wages will significantly disappear.
As labor costs become less of a factor in the manufacturing process, transportation costs will become more important and supply chains will begin to shorten. While movement of commodities like raw material and particularly, energy, by ocean freight will continue to be important, the transportation of finished goods and components in containers will decrease.
As productivity rises and the developed world economies age through increased longevity, the under-developed economies will continue to see major increases in population growth but little increase in wealth per capita. Thus the real problem is just who will be able to purchase the world's output if there are no meaningful jobs.
First, William A. Sahlman, Professor and Associate Dean of the Harvard Business School made the following shocking statement in May 2011 before an alumni group in Dallas.
"You cannot believe anything you read in the New York Times and the Wall Street Journal, they all lie!"
To which I might add, most of the mainstream media also are guilty (CNN, MSNBC, Fox, CNBC, etc.) ... at least of misrepresentation of the facts which are provided by the Ministry of Truth. The days of investigative journalism are now limited to sensationalism and to politically driven agenda's. The search for facts has mostly fallen to the non-mainstream world.
Jürgen Stark, member of the executive board of the European Central Bank in his lecture at the Federal Reserve Bank of Dallas stated:
"Globalization is a failed concept!"
Keep these two comments in the back of your mind when you are trying to evaluate any scenario about the economy.
To be a successful long-term investor requires a global perspective. As the two major problems cited above suggest there are major shifts developing which may change the basic structure of business and finance during the 21st century.
According to the International Monetary Fund (IMF), world GDP for 2012 is estimated at $65.3 trillion and the U.S. economy at about $15.5 trillion as shown in the following table.
In 2011, the U.S. required an amount greater than world savings to finance its federal and trade deficits. In 2012, it will be the same. The only solution is to print more fiat currency and hope that creditors don't ask for payment.
There are several factors that will play an important part in the economic events in 2012 and beyond. I characterize these events as "red herrings." In no particular order, they are:
| Competition for the world resources. | |
| The world's largest debtor nation trying to lead world opinion based upon its "supposed" military superiority. | |
| The continued diminishment of the dollar as the world's reserve currency. | |
| The growing impact of Russian/Chinese and Middle East economic and military alliances. | |
| A civil war in Iraq disrupting the region as the Kurds, Sunni's and Shiite's all seek greater autonomy after the U.S. withdrawal. | |
| An attempted closing of the Straits of Hormuz by Iran thus restricting the flow of oil throughout the world. | |
| An Israeli strike against Iran triggering a wider conflict in the region. | |
| The growing role of Islam in Africa and Europe as the Arab Spring morphs into Islamic fundamentalism overthrowing many Middle Eastern regimes. | |
| Increasing political and economic turmoil in South America. | |
| The impact of environmental regulation upon food production. | |
| Election campaigning in the U.S. |
During the past three decades, there have been many changes to the methodology of preparing economic statistics in the U.S. Today, the difference between the official statistics coming from the administration (known as the Ministry of Truth, or MOT) and those from a group of economists of which John Williams of Shadow Government Statistics is the best known is striking.
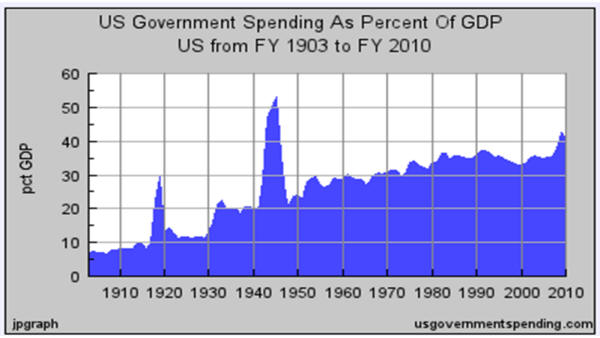
Despite the reluctance of Congress, spending has to be reduced as U.S. government spending has now reached over 40% of GDP as shown in the following chart.
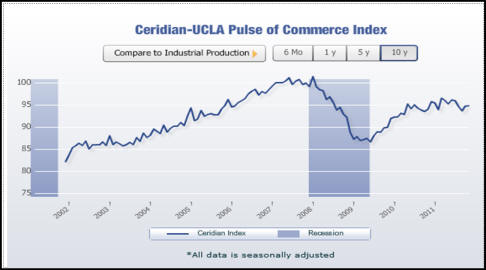
The Ceridian-UCLA Pulse of Commerce index measures the diesel fuel purchased at truck stops throughout the U.S. As such, it provides a leading indicator of the future economy. Recent data would indicate that the economy is slowing down.
The following three charts of gross domestic product (GDP), the consumer price index (CPI) and the unemployment rate show the differences as of the latest data available between the Ministry of Truth and Shadow Government Statistics.
As these three charts clearly illustrate, there is a significant difference in the official record and the real world. The real problem is that many decisions are made based upon the official record and not the real world data. The result is bad decisions are made and that the voters in a democracy are misinformed.
If GDP growth is really less than reported, CPI higher than reported and the unemployment rate over twice what is reported in the major news media, do you think voters, and/or our policy making bodies, would make the same decisions.
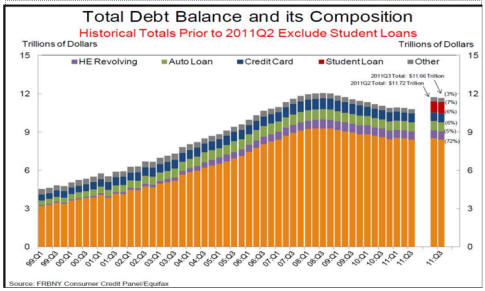
The financial meltdown and the demise of the housing ATM machine changed the relationship of the consumer to the overall level of the economy. For most of the last 30 years, consumer spending was over 70% of GDP. As unemployment rose during this economic recession, the consumer has not only reduced credit card usage but increased the savings rate. During the past four months of 2011, we have seen a leveling of the rate of decline in consumer credit with a slight increase. Sales incentives in autos have led to the slight increase in the level of consumer credit debt in recent months.
Consumer debt has been reduced in each quarter as shown in the following chart.
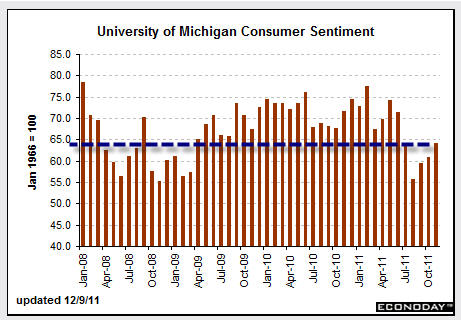
Since the beginning of the financial meltdown, consumer confidence fell by almost 45% and since the middle of 2009 has failed to make any significant movement higher as shown in the following chart. While consumer sentiment as measured by the University of Michigan has risen from its low of August 2011, the index remains well below the levels seen in 2009 through the first half of 2011. Historically, the last four months of the year have seen an increase in consumer sentiment.
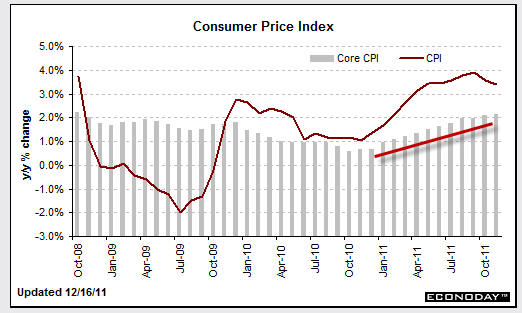
The consumer is concerned with real increases in the cost of living. The MOT's methodology changes have reduced reported inflation although the real cost of living is seeping into the public's consciousness. The difference in core versus total inflation as reported by the MOT is meaningless to the consumer. Yet even the reported CPI is beginning to show the effects of the governments printing machine as shown on the following chart.
Even with the rate of new jobless claims decreasing, the consumer is reluctant to spend and the old cliché that the consumer is 70% of the economy may be in trouble. The shifting priorities which are evident are:
|
Increased savings rate | |
|
Decreasing volume of credit/debit cards | |
|
Increasing reliance upon the shadow economy and barter transactions |
Those shifting priorities of the consumer will result not only in a reduction in GDP but will impact many other areas of the U.S. economy including:
|
Lower retail sales taxes will impact state and local government budgets | |
|
A reduction in GDP will increase unemployment benefits | |
|
To compensate for rising unemployment benefit costs, states will raise unemployment taxes | |
|
Lower sales taxes will further pressure state and local governments to raise property taxes which will further reduce the ability of consumers to meet be able to pay mortgages. |
When Congress mandated the affordable housing program known as Community Reinvestment Act of 1994 (CRA), it merely expanded policies that began under Franklin Delano Roosevelt in the 1930 which saw Fannie Mae, Freddie Mac and Sallie Mae added to the mortgage financing arena. However, the 1994 CRA passed under the Clinton administration also set into motion unsound lending practices which eventually almost brought the financial system to its knees.
One of the main contributors to the financial meltdown was the securitization of mortgages and the "mark-to-make-believe" valuation techniques which allowed both sides to a derivative transaction report a profit. Now elementary accounting suggests that in the long run that is simply not possible. The rating agencies, of course, also had a conflict of interest as some of their major shareholders were the very investment institutions that were selling investors those "AAA" rated derivatives.
Investors were mesmerized by the "AAA" rating and failed to perform their own due-diligence. In fact, many of them were unable to even unravel the concept of counter-party risk.
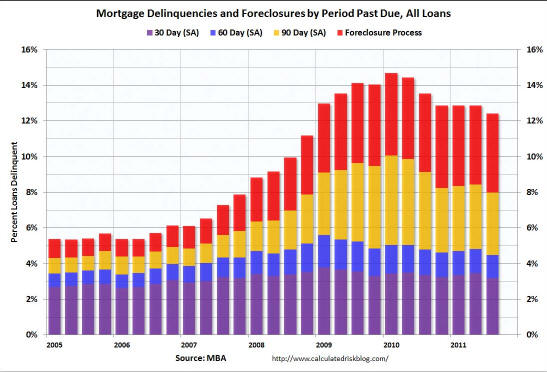
Despite efforts during the last three years to assist the housing it remains weak. Foreclosures will probably see an increase during 2012 and home prices will be under pressure as banks attempt to work off their shadow home inventories.
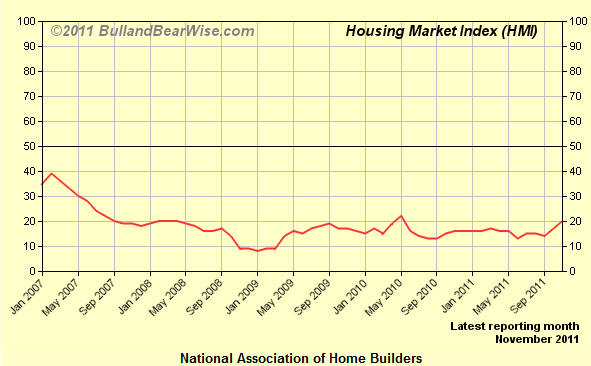
The National Association of Home Builders Housing Market index continues to be weak although it is improving slightly from the low levels that were seen in 2008 through the first half of 2011.
Of course, the recent revisions by the National Association of Realtors in the housing market data place all comparisons in doubt. An average of 14% fewer existing homes were sold annually between 2007 and 2010, according to revisions reported Wednesday by the National Association of Realtors, pointing to a housing market that was even weaker than previously believed.
During the revision's time period, there were average annual sales of about 4.42 million existing homes, compared with prior estimates of about 5.16 million. NAR revised the data to correct for supposed sampling and data-reporting problems.
The National Association of Realtors pending home sales index which tracks the number of contracts which are signed reached in November 2011 its best level since April 2010. How many of these pending sales are foreclosures and short sales is unknown.
Housing starts appear to have leveled off at an annual rate of about 600,000 to 650,000 homes/year which could be the new normal for a few years.
A sweeping revision sharply lowered five years of existing home sales data including October which was sharply revised to a 4.25 million annual rate from an initial reading of 4.97 million. Inventory of existing homes was 7 months which remains above the long-term average. The revisions make any comparisons this month somewhat suspect.
The national median existing-home price for all housing types was $164,200 in November, down 3.5 percent from a year ago. Distressed homes – foreclosures and short sales typically sold at deep discounts – accounted for 29% of sales in November (19% were foreclosures and 10% were short sales), compared with 28% in October and 33% in November 2010.
New home sales for November 2011, however, did not show the same increases as existing home sales. Supply, however, is now at just 6 months which is the lowest level since the recovery began.
It would appear that for the next few years, the new normal annual production rate for new homes will be about 600,000 to 650,000. If inventory of all homes drops to under 90 days then the market might be back to normal.
The housing market is not likely to improve anytime soon as many potential home buyers have now become renters or have moved towards multi-generational housing situations. While mortgage delinquencies and foreclosures continue to remain at relatively high levels, the housing market will remain subdued.
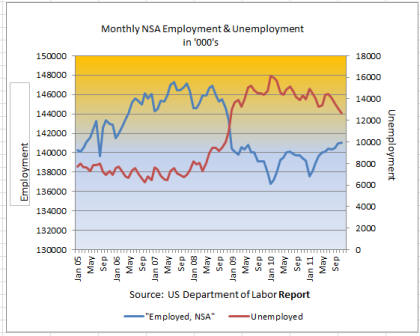
The financial meltdown since 2007 has brought into focus the production/globalization debate again. Peak non-farm employment on a non-seasonal basis occurred in November 2007 at 139,090,000. The bottom was in August 2009 when the series touched 129,719,000 or a fall of almost 10 million jobs. During the last two years, non-farm employment has managed to increase from that low to the November 2011 reading of 132,949,000 which still remains 8.1 million jobs below the peak in November 2007.
Source: Bureau of Labor Statistics
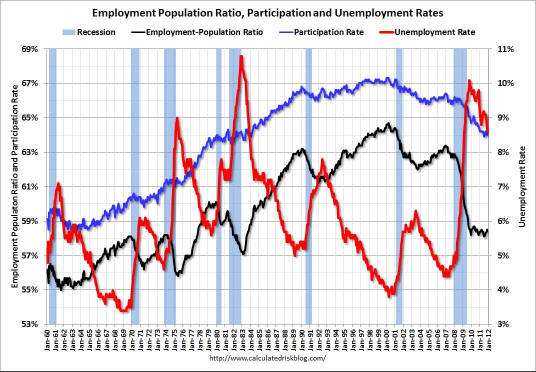
As of December 31, 2007, the population of the U.S. stood at 300 million. Today, it is about 312 million. Hence, the economy not only has to fill the 8 million lost jobs since 2007 but another 6 million jobs have to be found to return the economy to the same employment/population ratio it enjoyed in 2007. It will be a long haul.
The relationship between employment and unemployment since the Bear Stearns bankruptcy in 2007 can be seen in the following graph.
Globalization of manufacturing transferred jobs to low-wage countries and built up the knowledge and technical base of the non-developed countries where they have surpassed the U.S. in many ways. Because of their work ethic, the former U.S. technical superiority is quickly becoming reduced as a number of factors come into play as indicated below:
|
Desire for cost savings builds foreign competition for U.S. | |
|
Technical knowledge interacts constantly with manufacturing skills to improve processes. | |
|
Increases balance of payment deficits. | |
|
Countries with capital surpluses can purchase ownership interests and transfer intellectual property, |
The real outcome of the globalization movement has been a reduction in the technical superiority of the U.S. and a lowering of the standard of living for many of its citizens. Moreover, when there is an economic downturn, ownership tends to protect employment in the country where it is domiciled and makes layoffs in higher wage countries.
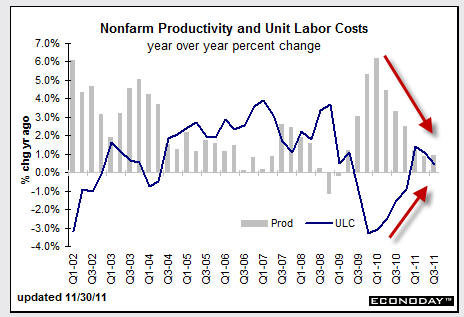
Productivity gains which were substantial in the U.S. during 2009 and 2010 as company's reduced workforces to a minimum have clearly been falling as shown in the following chart. Unit labor costs, however, as a result of rising health care costs rose from the end of 2009 and continues to increase although at a slower rate.
Industrial production remains about 6% below a year ago level although the capacity utilization rate is showing an increase from the bottom. Various measurements of the manufacturing economy like the Philadelphia Fed Survey and the Chicago Purchasing Managers index suggest that the depth of the downturn has been reached and the economy is now in a muddling-through phase. The question remains whether the current slowdown is a precursor to a downturn as events in Europe and Asia impact sales in the U.S.
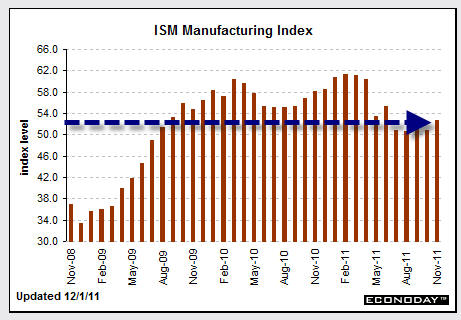
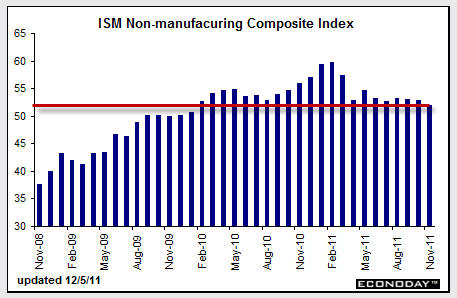
Various measurements of the manufacturing economy like the Philadelphia Fed Survey and the Chicago Purchasing Managers index suggest that the depth of the downturn has been reached and the economy is now in a muddling-through phase. The Philadelphia Fed Survey for December rose to its highest level since April 2011 in December 2011. It is a leading indicator for the industrial production index as it leads it by three weeks. However, the manufacturing economy continues to lose jobs and has fallen from over 40% of the economy in 1950 to under 15% today.
The latest data from the Midwest purchasing managers index, now called the ISM-Manufacturing Index, showed an increase to only 52.3 in November 2011 which is the highest reading since June 2011.
The increase in business activity as seen in both the Philadelphia and Chicago surveys has raised the concerns over rising prices in the coming months. The Producer Price Index (PPI) thanks largely to rising food prices rose 0.3% in November 2011. During recent months, food and energy prices have been somewhat volatile but core CPI as shown in the second chart has been increasing since November 2010.
Durable goods orders have moved somewhat erratically during 2011 as orders for transportation equipment have ebbed and flowed. However, on a yearly basis, durable goods orders have remained positive versus 2010. There does not appear to be a consistent improving trend in the data as shown in the table.
The ISM non-manufacturing index fell in November 2011 to its lowest level since January 2010 as the economic malaise has affected even government and service jobs.
According to the MOT, the unemployment rate in the U.S. in November 2011 fell to 8.6%. To obtain this data point, the MOT decided that 315,000 workers were no longer "seeking work". Hence, the employment-population ratio fell to 64%. As noted earlier, John Williams of Shadow Government Statistics calculates the unemployment rate at 22.6%.
New jobless claims have fallen from about 650,000 per week in the 1st quarter of 2009 to under 400,000 in December 2011. The question is whether this is a sign of an improving job market or that corporations have cut staff as far as economically feasible. The current level is still about 50% higher than the average level in the 2000-2007 periods. The productivity data shown above would suggest that many workers have improved their efficiency as they have become fearful of being laid off.
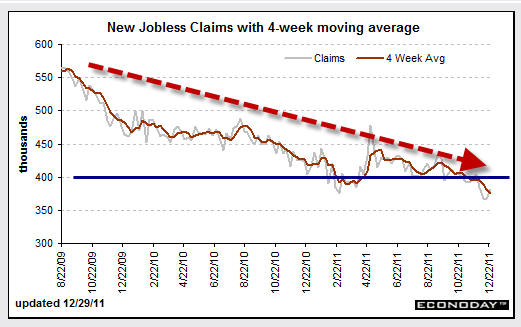
As always, I rely on the non-adjusted raw data to see the real picture. The following chart of new jobless claims covers the period from January 2007 to the latest report.
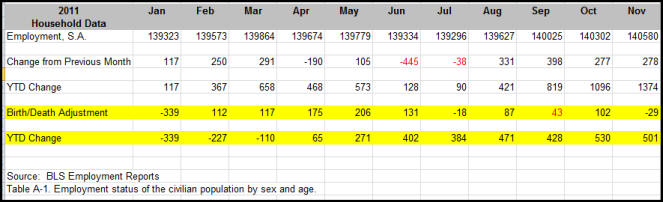
Through November 2011, the Bureau of Labor Statistics has reported that on a seasonally-adjusted basis, the household data survey indicated that about 1.374 million jobs were gained in the U.S. However, the birth/death adjustment, otherwise known as the "fudge factor", added 501,000 jobs. An analysis of those added jobs would suggest that most were pure fiction.
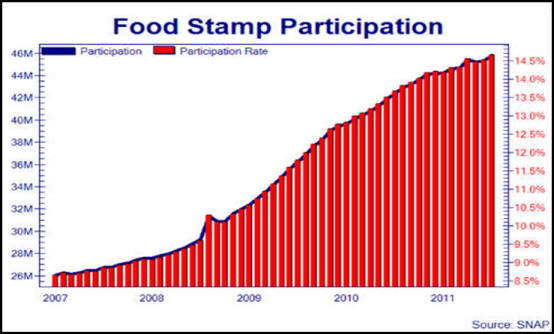
New jobless claims, unemployment benefits and extended unemployment benefits as well as food stamps have all helped to blunt the effects of a deleveraging economy. The following chart shows the growth in the number of food stamp recipients since 2007 from about 26 million to over 46 million now.
During 2011, the international trade deficit shows a slight improvement as the meltdown continued largely as a result of declining crude oil prices.
The following chart compares the export and import of goods on a balance of payments basis since 1995.
With the U.S. dollar index falling from a high of $122 in January 2001 to a low of $70 in 2008 and back to $80 at the end of 2011, it should be apparent that the lack of domestic manufacturing and reliance on off-shore energy has contributed significantly to the trade deficit.
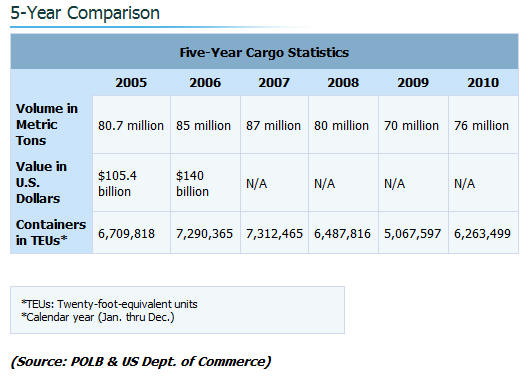
The health of the economy can also be seen by measuring container traffic units (TEU's). The following charts of container traffic at Long Beach, California, the largest container port in the U.S. shows the extent of the decline in 2011.
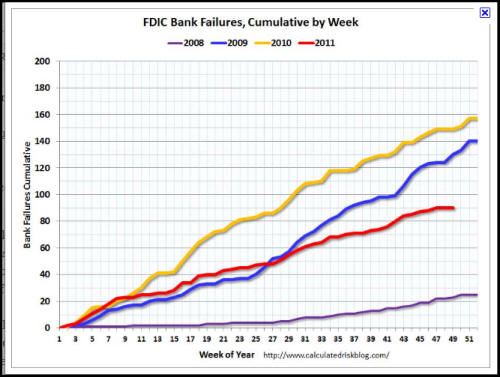
To calm the financial market as money funds "broke a buck" in 2007, the Federal Deposit Insurance Corporation (FDIC) raised its deposit guarantee limit from $100,000 per account to $250,000 on a temporary basis where it remains today. Today, while we have lost many financial institutions during the past five years, I am still concerned that the "to-big-to-fail" (TBTF) policies will eventually end badly for the U.S. citizens. The following chart shows the bank failures from 2008. The number of failed institutions and assets that the FDIC absorbed declined during 2011.
In effect, the temporary guarantee of the FDIC added another $5 trillion to the $9.8 trillion in stated cash debt to the U.S. taxpayer's obligations as of 2007. Thanks to the temporary status of the raised guarantee, the FDIC did not have to increase its capital base. It was another case of the federal government using accounting techniques that got Enron executives' jail terms.
The TBTF banks still concern me as not only do they have significant toxic assets on their balance sheets but also hold the majority of derivatives. If Citicorp or Bank of America go bankrupt in the near future, the TBTF concept will be proven false.
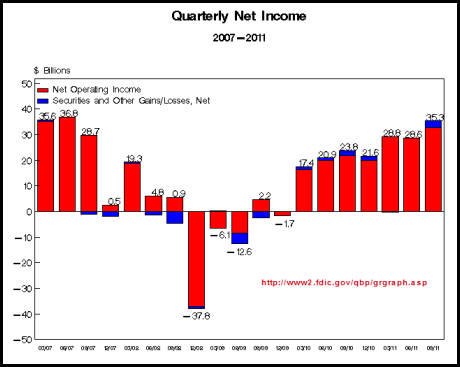
The FDIC was able to obtain from the U.S. Treasury a commitment for $500 billion in 2009 to backstop its guarantee to depositors. If you can believe the FDIC 3rd Quarter report, banks are now making money thanks to the FASB 157 changes as seen in the following chart.
The number of problem institutions as defined by the FDIC has increased from 50 at the end of 2006 to 888 at the end of the 3rd quarter of 2011. It has fallen to 844 at the end of the 3rd quarter of 2011. Toxic loans primarily in the housing and commercial real estate markets continue to a problem for many regional and community banks as well as credit unions.
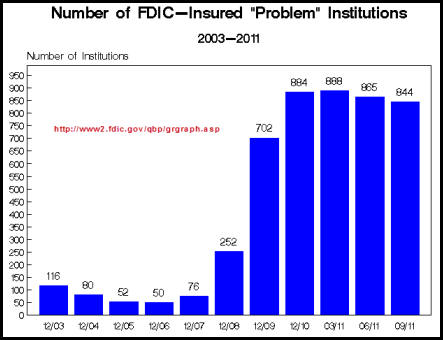
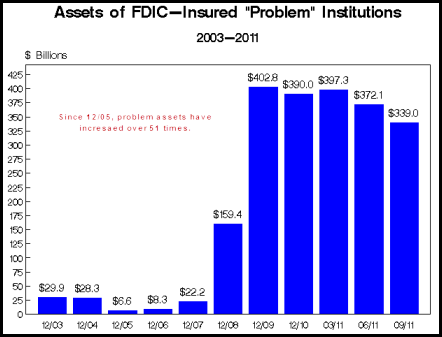
While the almost 17-fold increase is frightening, it is not as bad as the increase in assets of those problem institutions as shown in the following chart.
There appears to be a split between economists as to whether the economy is on the road to recovery or headed to a double-dip recession. Most Keynes disciples ignore the work of economists like John Williams of Shadow Government Statistics who points out that only the hedonic and seasonal adjustments as well as changes in the methodologies of calculating many data series allows the Ministry of Truth to show an economy that has moved into a slow recovery mode.
Most of the upturn has occurred through the massive infusion of funds via the Federal Reserve System and its quantitative easing policy that has poured trillions into the banking system. With a shadow QE3 (Operation Twist) in operation as well as a covert bailout of the European banking system through swap agreements, the Federal Reserve and other central banks remain committed to a policy of increasing liquidity and financial system debt which in a deleveraging cycle will not work.
While such a policy might have worked in a low or moderate debt environment as envisioned by Keynes, the policy is now in an environment where each added dollar of debt does not generate a dollar of GDP growth. The economy can no longer grow its way out of the debt problem. Only by cutting spending and reducing debt even with GDP being contracted, can the debt problem be solved without hyper-inflation igniting currency debasement.
Some analysts point to a rebound in corporate profits as proof that the economy is doing better. However, they fail to mention that changes in accounting practices account for much of the improvement. For most companies, top line revenue growth remains limited or below levels of previous years when adjusted for inflation. In fact, almost all of the increase in reported profits by financial institutions in 2011 was as a result of FASB 157 changes in accounting practices.
Nevertheless, corporate profits as reported by the MOT have shown an increase in each of the last three quarters as shown in the following chart although the preliminary estimates have been reduced with each revision. The financial sector represents about 20% of total after-tax profits in 2011. Many analysts would suggest that most of the large banks are technically bankrupt.
FASB changes and cost cutting measures are only short-term fixes. The economy will not be on the mend until employment increases significantly and real revenue growth occurs.
Over the last twenty years, the U.S. Treasury has made a series of miscalculations that now create a major problem. The following chart shows the reduction in the Treasury average interest rate from 1982 to the present.
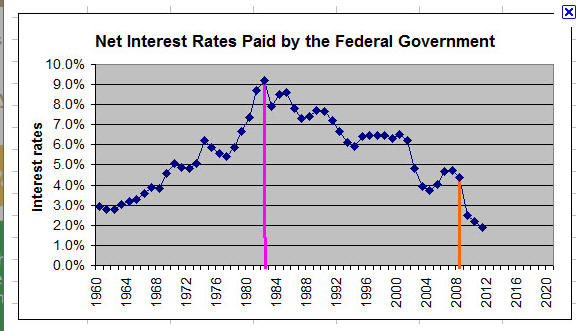
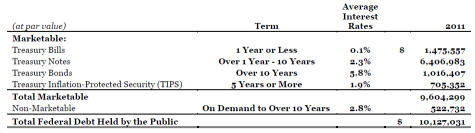
As of September 2011, the outstanding debt held by the public and average interest rates are shown in the following table.
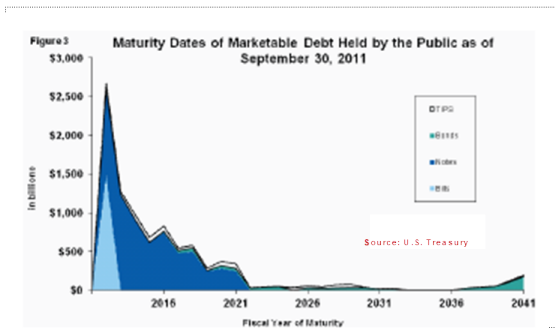
Rather than taking advantage of low long-term rates since 2009, the U.S. Treasury opted to continue a policy of borrowing short to reduce immediate budget deficits as the maturity schedule dropped. As a result the maturity schedule has now caused a major problem for the Treasury as shown in the following chart. In 2012, the U.S. Treasury will have to refinance about $2.6 trillion plus the FY 2012 deficit which is expected to be another $1.3 trillion, or a total of $3.9 trillion.
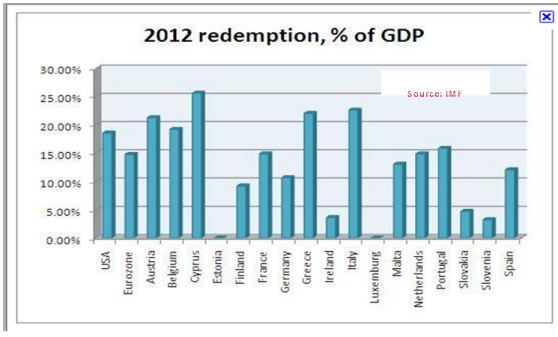
The refinancing problem is not confined to the U.S. The following chart shows only the redemptions of sovereign debt as a % of GDP and does not include ongoing deficits.
In the U.S., rather than repudiating the debt, both political parties continue to pay lip-service to fiscal restraint but continue an unrestrained spending spree.
The political games surrounding the debt limit debate, the imposition of a Super Committee on the budget that ultimately failed to agree on anything, and the "automatic reductions" which might not happen are all symptoms of a political system that refuses to realize that spending is the problem and must be addressed.
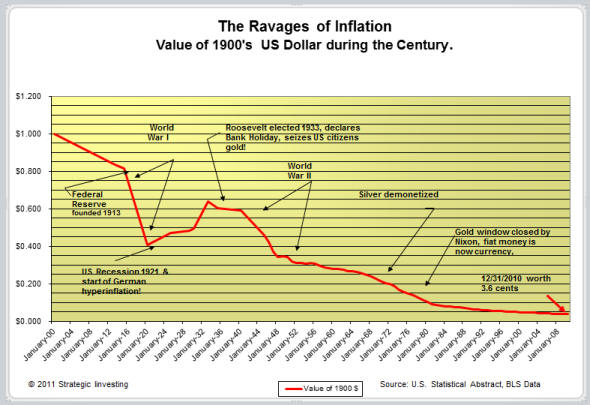
As a result, the decisions of the U.S. Treasury and the Federal Reserve based upon Keynesian economics has eroded the purchasing power of the U.S. currency and is now threatening to significantly reduce, if not destroy, the purchasing power of the U.S. dollar. During the last week of 2011, China and Japan agreed to use their individual currencies to settle accounts rather than the U.S. dollar ... just another reduction at the role of the U.S. dollar as the world's reserve currency. The following chart tracks purchasing power since 1900.
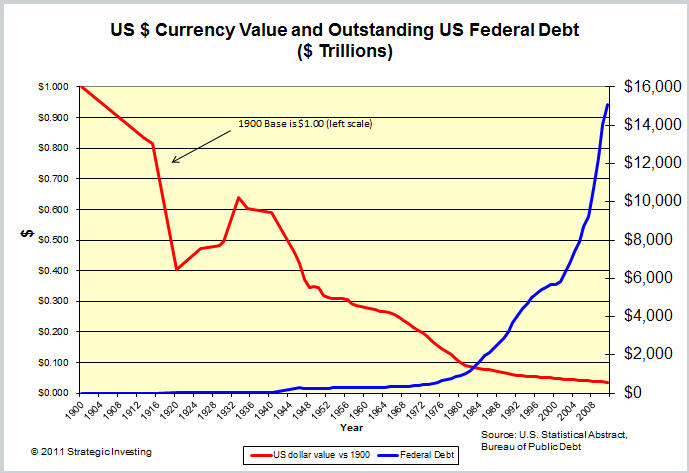
It is interesting to look at the inverse relationship between the U.S. dollar and the growth of the stated cash debt of the U.S. as shown below:
The inability to reduce spending to meet revenue has now brought the U.S. sovereign debt position to a critical point where the tremendous financing requirement coupled with a burgeoning deficit could well create a failure of a Treasury auction in the near future.
The U.S. Treasury is audited by the General Accounting Office (GAO) each year. The FY 2011 report was released on December 24th. The report is prepared using GAAP accounting principles rather than the cash-based accounting which is the focus of much of the media attention.
The GAO report also contains serious reservations about the accuracy of the data from various departments which are responsible for over half of the assets and liabilities in the report. The following schedule augmented by information supplied by Shadow Government Statistics which clearly shows that any rationale analysis of the data would indicate that the U.S. has gone beyond the point of no-return unless draconian measures are taken. Where the “Alternative” data used here show $80.9 trillion of U.S. government debt, obligations and the net present value of the unfunded social security liabilities, as of September 30, 2011, that likely is shy of reality.
Adding estimates of government liabilities in, and exposures to Fannie Mae, Freddie Mac, the PBGC and FDIC easily could take that total into the $100 trillion range.
The day of reckoning is nearly here. By any measure, the United States is bankrupt. The only question is when will our creditors pull the plug?
The Federal Reserve’s monetary policy objectives as set form in Section 2A of The Federal Reserve Act of 1913 as amended states:
"The Board of Governors of the Federal Reserve System and the Federal Open Market Committee shall maintain long run growth of the monetary and credit aggregates commensurate with the economy's long run potential to increase production, so as to promote effectively the goals of maximum employment, stable prices, and moderate long-term interest rates."
[12 USC 225a. As added by act of November 16, 1977 (91 Stat. 1387) and amended by acts of October 27, 1978 (92 Stat. 1897); Aug. 23, 1988 (102 Stat. 1375); and Dec. 27, 2000 (114 Stat. 3028).]
As Section 2A states the objective of the Federal Reserve System was to promote “maximum employment, stable prices, and moderate long-term interest rates.”
As we have previously shown in this Outlook, it is our opinion that the Federal Reserve since 1913 has not achieved these goals and hence, should be disbanded. In effect, the Federal Reserve is in business for the banking institutions and not in the business of protecting the public. Whether it rebates its profits to the U.S. Treasury or not is immaterial.
Since the beginning of the financial crisis in August 2007, the Federal Reserve's balance sheet has grown in size and changed composition. Total assets of the Federal Reserve have increased from $869 billion on August 8, 2007 to $2.920 trillion today.
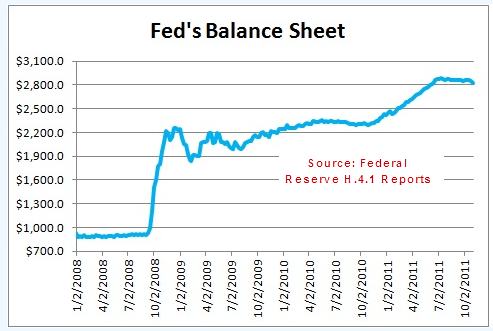
In August 2007, the Federal Reserve held over $800 billion of U.S. Treasury instruments. As of December 28th, the Federal Reserve held $1.671 trillion in U.S. Treasury instruments. As the Federal Reserve engaged the financial crisis in various ways, the balance sheet grew and the quality of its assets diminished. During the second half of 2011, the Federal Reserve ended up purchasing about 70% of the new issues through prime dealers and Operation Twist. The following chart of its system open market account holding shows the growth. The amount of mortgage-back securities shown in the chart are carried at par value whereas the market value is significantly less.
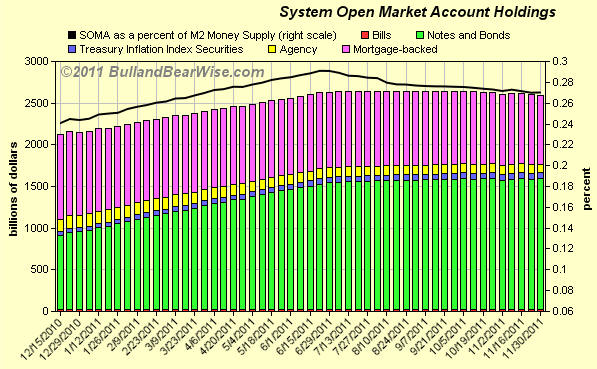
The growth of the Federal Reserve's balance is based upon nothing but hot air. In actuality, the Federal Reserve simply adds figures to a computer register and suddenly, there appears more "fiat currency" which it can now use.
The biggest casualty world-wide of the financial meltdown is the lack of confidence and trust in the U.S. financial system. As that trust continues to erode, the ability of the Federal Reserve to issue paper that is worth more than tissue paper is also impacted.
The TARP program was supposed to fix the financial system. However, the decision of the Federal Reserve to pay interest on non-borrowed reserves provided bankers with free money and a no-risk 2% return at a time when credit standards were being tightened and Tier 1 capital was needed to avoid being placed on a "troubled bank report."
The over-reaching of the Obama Administration into controlling not only the lending practices but also the compensation practices of those receiving TARP funds has moved many to repay the TARP loans rather than increase customer lending.
Qualitative Easing policies in the last four years has significantly increased the supply of money (M1) while keeping M2 and M3 growing at a lesser pace as shown in the following graph.
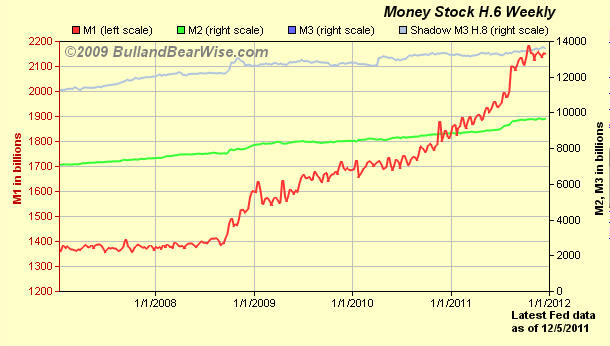
For the moment, the growth of M1 has not resulted in severe inflationary pressures. Historically, that has not been the case and it could create problems at any time.
Not only the U.S. but the world is facing a financial crisis. Most Keynes' economists and politicians have yet to come to grips with the deleveraging concept and continue to push solutions that involve more liquidity when the problem is insolvency.
There is one fundamental law that the politicians have not learned.
You cannot borrow your way out of debt!
The bond market dwarfs the stock market. With the Federal Reserve in conjunction with the U.S. Treasury attempting to control interest rates, a major clue to the economic viability going forward will be found in the rate of interest required to refinance debt as well as the spread between short and long-term yields. The vulnerability of those rates can also be seen in the CDS rate quotations which for almost all sovereign debt have been increasing in recent months including the U.S. CDS rates.
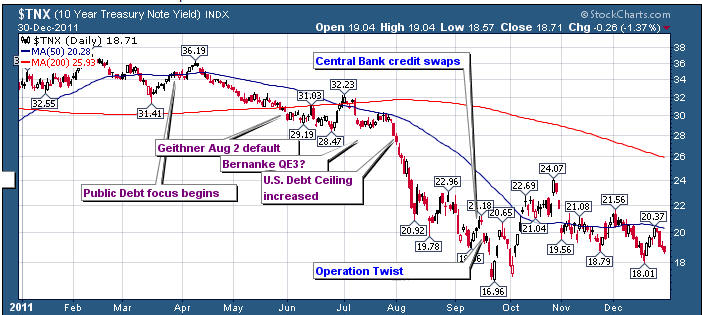
Over recent weeks, the rate spread on U.S. Treasuries has widened as shown in the following chart from bondheads.com.
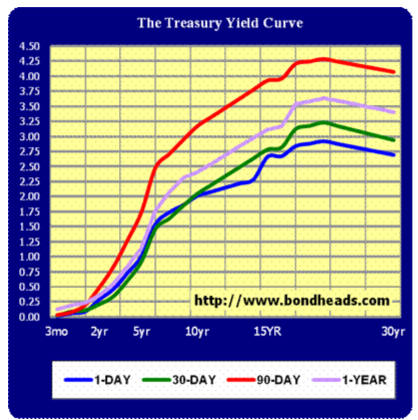
The Federal Reserve's Operation Twist program as well as the Eurozone turmoil which saw massive funds flow into the U.S. managed to shrink the risk premium on U.S. Treasuries during the last half of 2011 as shown in the following chart.
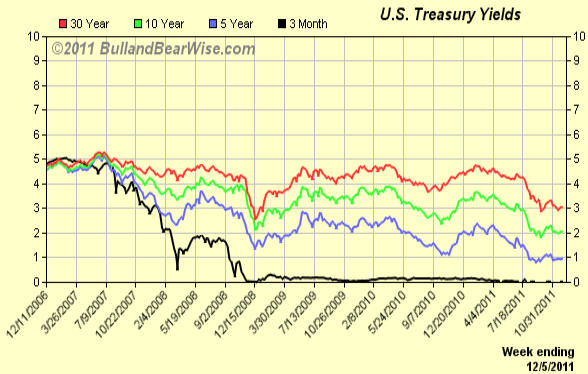
The following three charts show the recent trend of the 90 day, 10 and 30 year Treasury offerings. The Federal Reserve's Operation Twist program along with the Eurozone financial mess has helped reduce rates throughout the yield curve during the last quarter of 2011.
As the U.S. Treasury goes to market during 2012 for its massive requirements, interest rates may come under pressure. The current levels of interest rates are at historic lows and will increase in time.
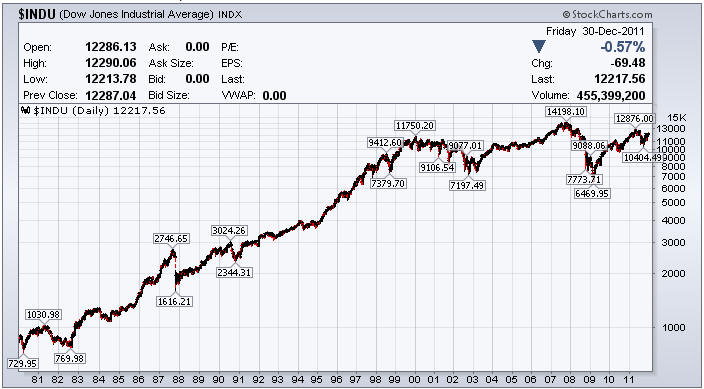
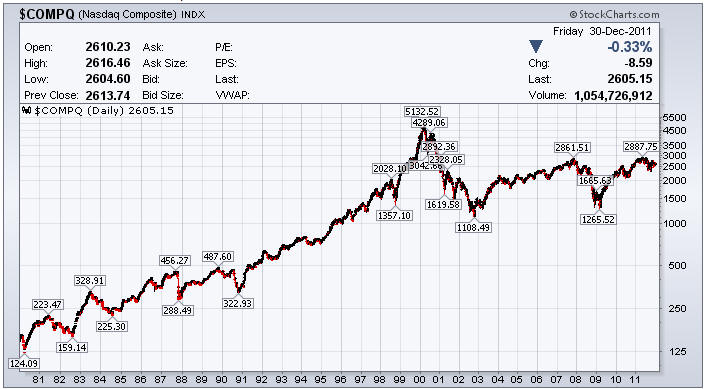
At the close of 2012, the Santa Claus rally was running out of steam. From a historical perspective, the following charts show the major indices' movement since 1980.
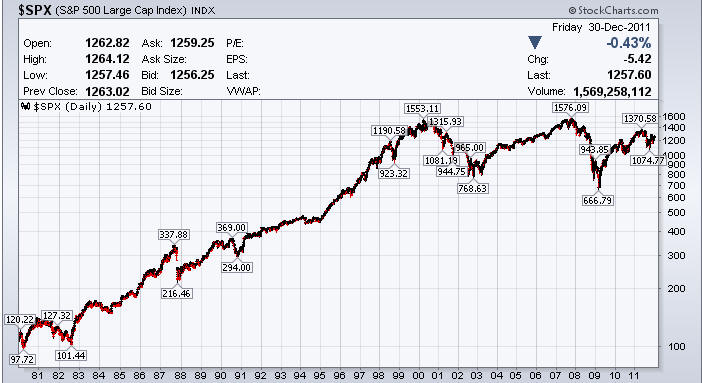
During 2011, the S&P 500 index was in positive territory until the beginning of August. However, with the Eurozone problems and worries about a double dip in the U.S., the S&P 500 went negative and ended the year almost flat.
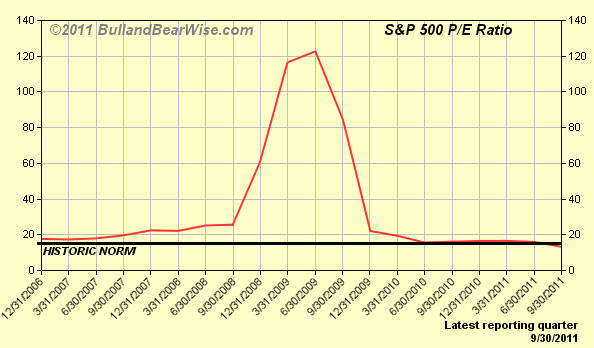
At the end of the 3rd quarter of 2012, the price/earnings ratio of the S&P 500 stocks had risen to an all-time record level as shown in the following chart. Historically, the range for the P/E ratio was between 6 and 30. However, the FASB 157 changes are now impacting the relationship of the S&P 500 earnings and whether the current P/E ratio is correct is of concern to those interested in reality.
During 2011, the NASDAQ index followed a similar pattern as the S&P 500 and ended with a loss of 1.8% for the year.
Many investors look to the Dow Jones Industrial Average (DJIA) as a gauge of the markets health. However, many professional investors do not. During 2011, the DJIA outperformed the NASDAQ and the S&P 500 to end with a 5.5% gain.
At the end of the 4th quarter of 2011, using data from Investor's Business Daily, we prepared the following table of the Dow Jones Industrial Average stocks.
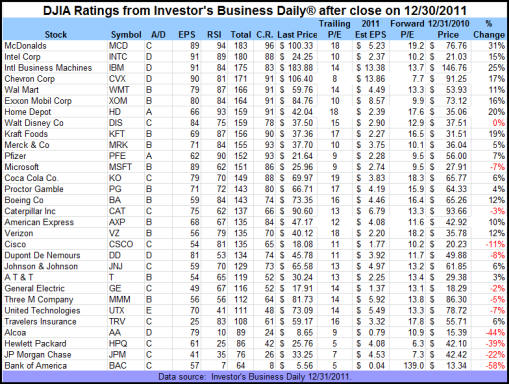
At the moment, it would appear that the new money flowing into the market from pension fund money will enable the first couple of weeks to be positive. However, the trend of the market could well change if the earnings forecasts are not realized.
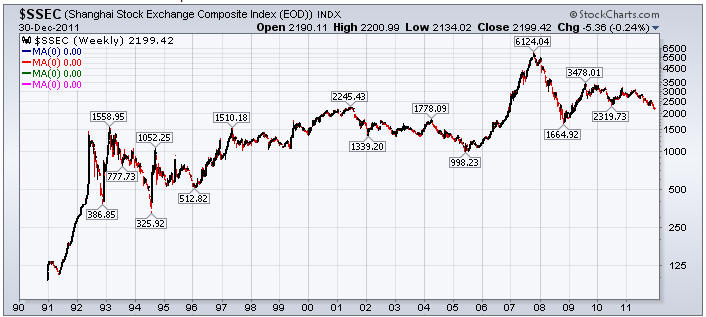
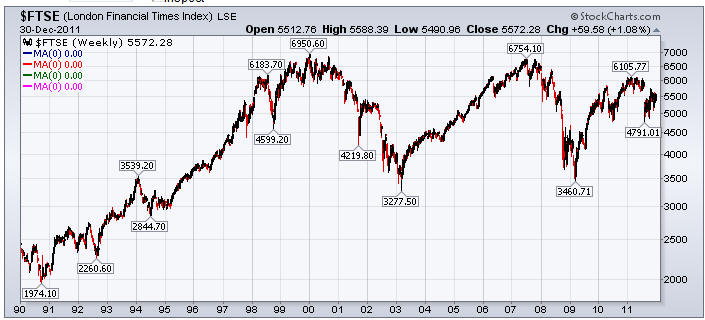
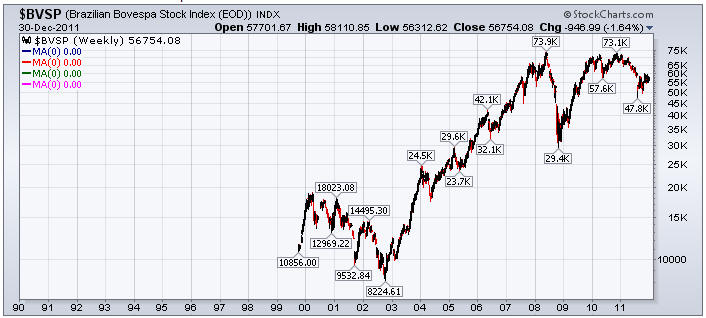
With the U.S. economy under stress in 2011, many investors looked to foreign markets for not only diversity but also improved portfolio performance. The following charts show the major foreign indices from a historical perspective.
Despite economic growth that continues to exceed that of most other countries, the Shanghai index suffered a higher loss since 2008 than the U.S.
During the next decade, China's growth will be more dependent upon its export potential to countries other than the U.S. and the ability to handle the growing unrest of its population. Accounting standards in China are less strict than in the U.S. The Chinese government also controls the access to capital and with growing unrest in various areas; the outlook for continued growth is somewhat suspect.
The years of rapid growth fueled by an infrastructure build-out and real-estate spending is winding down and the country is facing problems from political change and unrest. Exports are down not only to the U.S. but to much of the world as other nations take advantage of their lower wage costs to undercut China's labor costs.
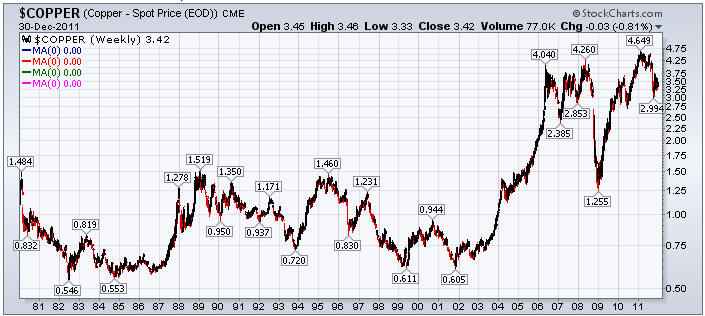
During the next year, China will undergo a major change in the political hierarchy. The military will attempt to remain in control but internal divisions are becoming a problem. The country has invested heavily in commodities and in the case of copper now has considerable exposure to downward pressures in price.
While China will continue to grow, it will not be at current rates. Remember that the data from China should be taken with a grain of doubt as their accounting system is suspect as are their official government statistics.
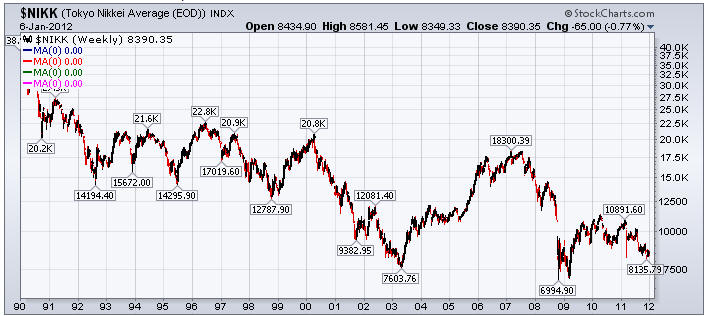
Japan is still the world's third largest economy. However, the banks are still loaded with toxic assets resulting from the real estate bubble of the 1980's. Official policy has kept interest rates near zero percent. As a result, an increase of only 2% in the average interest on sovereign debt will be more than all Japan's government revenue. With an aging population, Japan will be turning towards alliances with China in the future rather than the U.S. As a result, Japan's holdings of U.S. securities will continue to be reduced in the future.
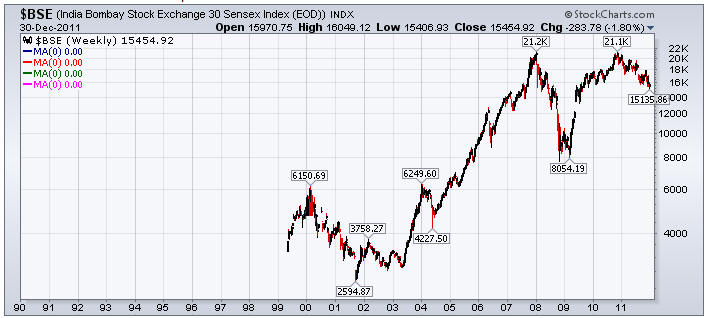
India will benefit from the fact that much of its workforce speaks English. The country is probably going to increase its presence in technology and manufacturing over time.
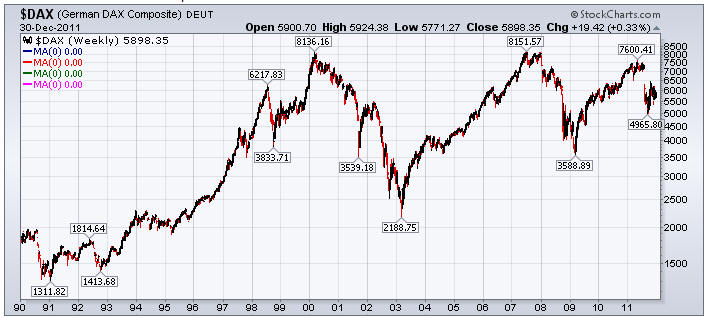
Germany remains a country that is built upon its exports. Leverage in many European banking institutions was double that of the U.S. banks. German banks have a significant exposure to the sovereign debt of the PIIGS which clouds the economic outlook and dictates the country's response to the Euro debt problem. Recent economic data from Germany indicates a slowing of their export driven sales. Of the Eurozone members, Germany will probably be the last one standing on the continent.
England's decline as both a free society and a world power continues. Its immigration and taxation policies have taken its toll. Its role as a world financial center is in danger and for the most part, most of its industrial complex is inefficient and the work ethic has been lost. The recent vote against the ECB opens up the question of whether the U.K. will remain a part of the Eurozone. The long-term outlook for the U.K. is not promising.
Brazil has been a country with a future. Blessed with a small population in a vast land with natural resources, Brazil has been the place to invest for the past decade. The government is now undertaking policies which will hamper outside investment as well as internal growth. Development of infrastructure is slowing and environmental regulations are also increasing economic difficulties.
The financial meltdown has obviously had a world-wide impact. There are risks to investing in foreign countries. With a growing Islamic population, the outlook for Europe is negative. Prudent investors should try to restrict their investments to those companies that trade ADR's or in ETF's with significant liquidity.
As 2012 begins, the world's population growth and the impact of environmental regulations coupled with drought conditions in many areas have created an increased concern about a food crisis. Increasing demand, low crop carry-overs as well as increasing concerns about drought in many areas of the world suggests that prices of agricultural commodities will be facing upward pressure in 2012.
Recent production and usage data for corn and soybeans can be seen in the next two tables. Ending stocks for both corn and soybeans are at historic low levels both on an absolute and per-capita basis.
Drought conditions throughout the growing areas of Argentina, China, India and the 'Stan's have combined to reduce food production in 2011 and the drought continues in many of these growing regions. Crop production estimates for Brazil and Argentina were reduced just last week.
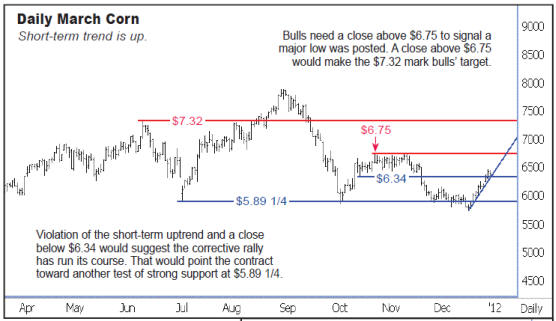
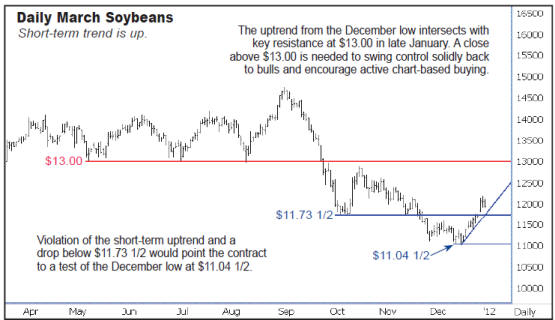
Near-term price trends for the wheat, corn and soybeans are shown in the following charts.
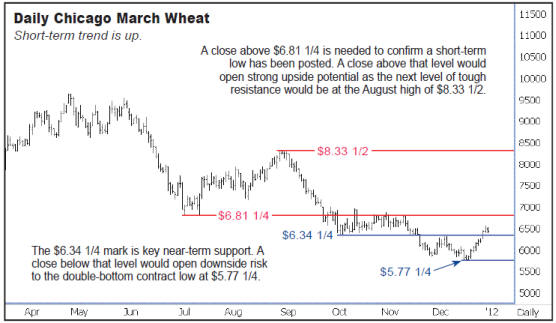
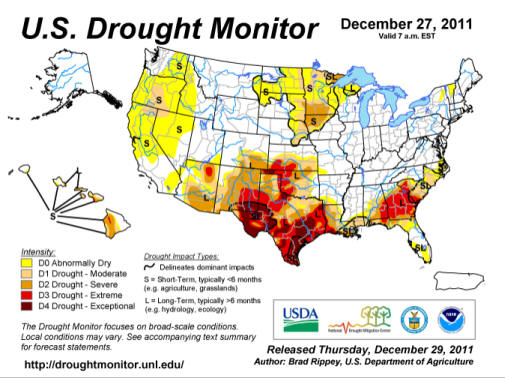
The U.S. drought monitor shown below shows the U.S. situation becoming increasing dry in much of the crop production areas. Food production in 2012 will be critical and crop failures could mean disaster for many.
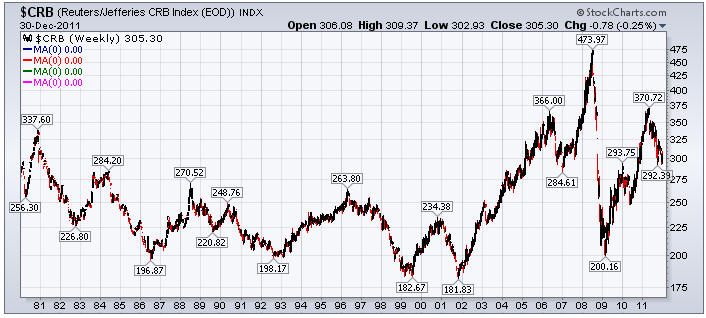
The CRB index has fluctuated dramatically in the last ten years. Some of the fluctuation was due to inflation and changes in the index weighting.
The price of copper often leads future economic activity. In 2011 it fell from an all-time high of 4.649/lb. to 3.42/lb. The potential for a further decline exists.
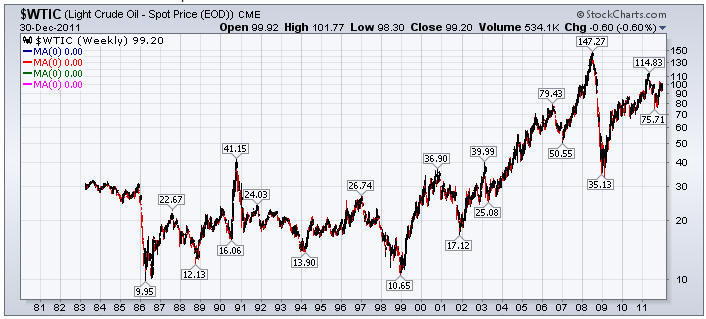
The price of crude oil in dollars will depend largely on the strength of the U.S. dollar and the production/demand equation. The movement to price oil in a currency other than U.S. dollars could obfuscate the real movement in the production/demand relationship. Events in the Middle East will largely dictate the price of oil during 2012. The U.S. could substantially reduce its dependency upon foreign oil by:
|
allowing drilling in Alaska, | |
|
lifting the environmental restrictions on coal, | |
|
allow drilling in the Gulf of Mexico and both the West and East coasts, | |
|
increasing the land open to shale oil drilling, | |
|
taking advantage of its natural gas resources | |
|
and increasing the use of nuclear power. |
The alternative energy solution will be proven to be just a "pipe dream."
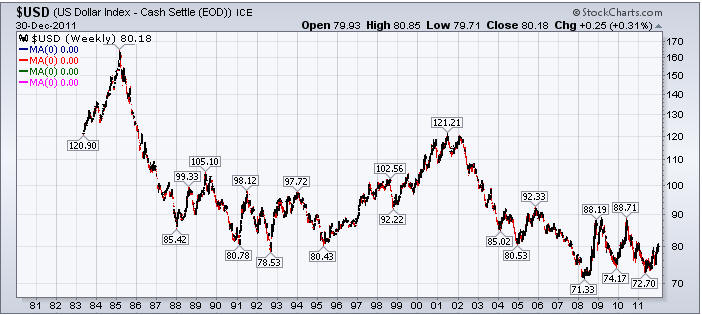
The U.S. dollar has recently improved and for the next month could continue to show improvement. However, unless the U.S. dollar index moves appreciably above the $80 level, the upward movement may only be temporary as the massive financing requirements of the U.S. Treasury will impact the dollar's value. During 2012, competitive devaluations will become more visible as many countries strive to gain a trade advantage.
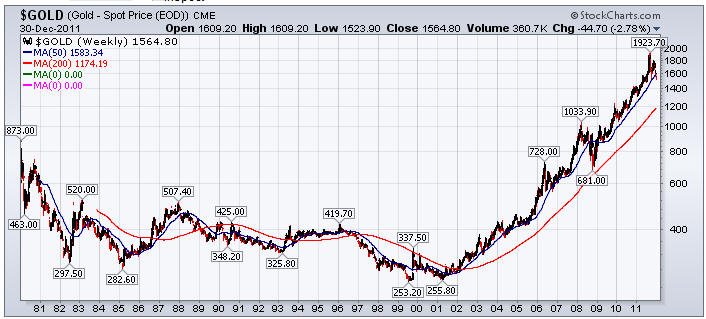
Gold's performance during the last decade has been outstanding, although, most investors have not profited from the shiny metal. As long as fiat currency remains, gold will always be a store of value. However, do not be fooled, it is subject to market manipulation by central banks. Technically, the recent move below its 50 day moving average suggests caution. However, remember that gold is a storehouse of long-term value not subject to the whims of fiat currency. You should own it because of the safety it provides not for short-term appreciation.
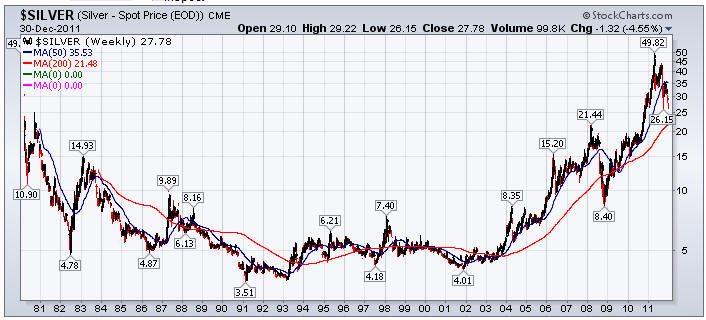
Silver's performance during the past decade has also been good. Recent market action has left silver also below its 50 day moving average.
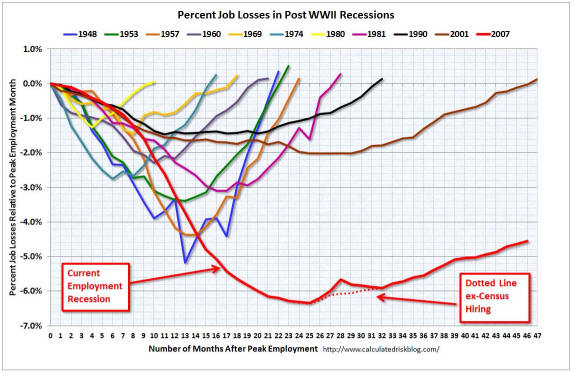
The forecast for 2012 remains difficult. The Federal Reserve will continue its policy of increasing liquidity and protecting its owners .... the banks. It will continue to give lip-service to its mandates of price stability and employment. The Obama Administration will continue to issue onerous regulations that will increase costs throughout the country. Despite declines in new jobless claims and continuing claims, unemployment remains high and the outlook for new job creation is not robust. Increasing jobs is probably the most difficult problem facing politicians. The current recovery (if you want to call it that) is one of the worst on record as seen in the following chart.
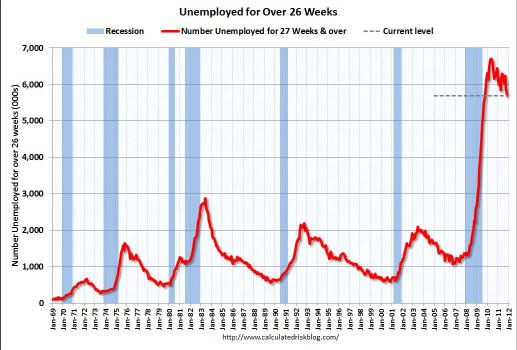
The number of people whose have been unemployed for over 26 has risen to levels never seen before in this country as seen in the following chart. Moreover, increasing benefit costs have diminished the chances of a worker over 55 ever gaining long-term employment at wage-levels similar to the levels prior to layoff.
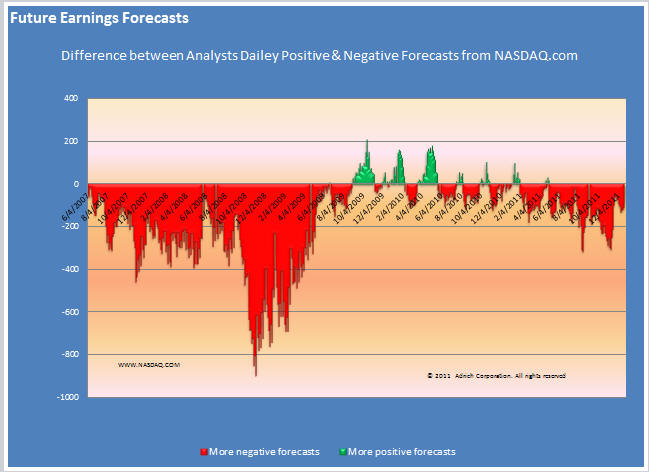
The following chart shows the difference between the number of companies that analysts are increasing earnings forecasts on a daily basis less those companies whose forecast are decreasing. The lack of a major turnaround in the 4th quarter of 2011 suggests that any economic revival might be weak. If that is the case, the equity market is probably due for a major correction.
Sectors that will probably under-perform the market consist of the following:
|
Housing
| |||||||||
|
Finance
| |||||||||
|
Firms dependent upon Medicare and/or Medicaid funding | |||||||||
|
Capital intensive sectors | |||||||||
|
Over-extended countries in Eastern Europe, Ireland, Spain, Greece, Italy and the Middle East |
Sectors that may out-perform the market might be:
|
RFID | |
|
Nanotechnology | |
|
Asset-based companies with little political risk | |
|
Medical devices | |
|
Geriatric companies including nursing homes, assisted living companies and funeral homes | |
|
Consumer staples as food and shelter are always required |
Prudent investors should remain cognizant of the following at all times during the year as they could provide clues to the equity and bond markets:
|
U.S. Treasury auctions | |
|
Increasing interest rates and widening credit default spreads | |
|
The passage of another stimulus package | |
|
Sovereign debt defaults (national, state or local) | |
|
Drawdown of U.S. Treasury and GSE holdings by foreign interests | |
|
Rising commodity prices | |
|
Decreasing sales tax revenues | |
|
Decreasing personal property tax revenues |
Alternative investments to the stock and bond markets have always been attractive and in the current environment should be considered by investors. Some of these are:
|
Class 1 agricultural land | |
|
Commodities including copper, corn, soybean and wheat futures. | |
|
Timber land | |
|
Gold and silver bullion and coins | |
|
Art work | |
|
Annuities but be aware of counter-party risk. | |
|
A cash-producing business | |
|
Cash |
The above is only a partial listing. In every downturn, those with cash at the bottom often are in a good position to take advantage of the upturn.
As the U.S. election process during 2012 becomes the focus, the political mood of the country should be monitored. The baby boomer generation marching towards retirement holds the biggest voting bloc. The question is whether this group is willing to further sacrifice their living standards as retirement nears.
Voters that work for a governmental agency amount to about 17% of the electorate. When you count their spouses and significant others, this group accounts for about 28% of the electorate. Whether they will be willing to sacrifice their pay scales and benefits which generally are greater than their private industry counter-parts is doubtful.
Also, over 50% of all voters receive greater benefits from the government than they pay in taxes of all types.
The current election will determine whether entitlements will be reduced going forward or the country will wait until a capital implosion forces an end to all entitlements.
The markets remain in a secular bear market that began in 2000. Most bear market cycles last from 15 to 20 years with the mean about 17 years. Using those parameters, I would expect the bottom of this bear market to occur in 2017. While we may have rallies, the predominant actual trend based upon purchasing power will be lower. However, we should also be aware that the U.S. Treasury along with the Federal Reserve has only one way out of their debt problem. Currency debasement is their preferred solution to the sovereign debt crisis. As a result, the market indices could actually show gains.
The following charts of the S&P 500 and the NASDAQ composite show the price of those indices in gold. When priced in gold, the S&P 500 has lost about 70% of its value since 2000 and the NASDAQ Composite index has fallen over 80%.
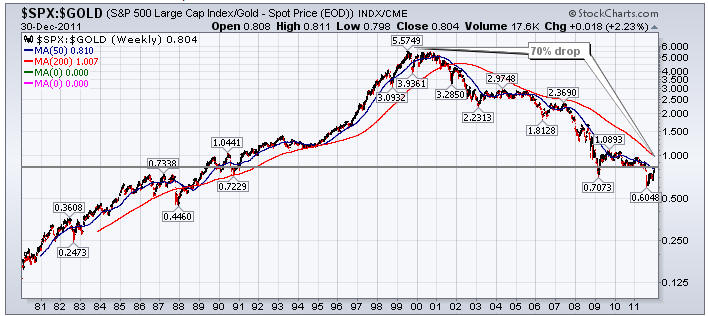
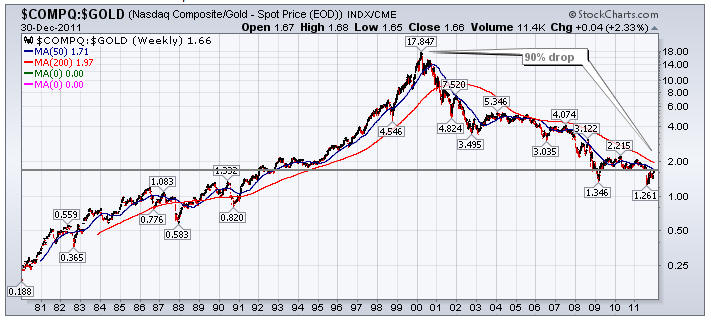
When the fiat currency system fails, investors will understand the concept of purchasing power better.
As we rush forward into the Presidential election cycle of 2012, the question arises about whether the economy and the stock market are in sync or are the tea-leaves simply not providing information that enables investors to make good decisions.
With all the challenges facing the bond markets to finance upcoming debt issues throughout the world as well as the increasing delinquency rates in many financial instruments and a Congress that continues to increase deficits, I have reluctantly concluded that the best result would be a "muddling-through" recovery scenario that might last several years.
The basic problem remains --
|
US FY 2012 GDP $15.5 Trillion | |
|
U.S. Cash deficit FY 2011 was 1.29 Trillion and GAAP deficit was $4.6 Trillion | |
|
U.S. stated cash debt is $15.4 Trillion and increasing | |
|
US GAAP FY Total Liabilities are north of $75 Trillion to $200 Trillion ... take your pick. |
Not only in the U.S. but throughout the world, politicians have simply promised too much to their constituents without providing the revenue to pay for those promises. The "kick the can down the road" mentality is quickly "running out of roads to kick the can on."
However, I am afraid that the Eurozone mess will continue to fester. Another "red herring event" could become a "black swan event" like Bear Stearns or Lehman Brothers. If another black swan event occurs, the economic problems and the interconnectivity caused by globalization could shake the world's financial markets to their very foundations.
The problem of too much debt in the U.S. and the world presents a conundrum for the world. Perhaps, it will prove to be unsolvable.
Prudent investors will be prepared and take only reasonable risks ... always with an escape plan to minimize their losses.
Fred Richards
December 30, 2011
Corruptisima republica plurimae leges. [The more corrupt a republic, the more laws.] -- Tacitus, Annals III 27
This issue of 'Tis Only My Opinion was
copyrighted by Strategic Investing in 2011.
All rights reserved. Quotation with attribution is encouraged.
'Tis Only My Opinion is intended to provoke thinking, then dialogue among
our readers.
![]()
![]() 'Tis Only My Opinion! Archive Menu
'Tis Only My Opinion! Archive Menu
Last updated - December 20, 2009