Sample size and frequency of sampling
Raw data and changes in how it is collected
Seasonal adjustments
Hedonic Adjustments
Substitution Factors
Independently vs. dependently adjusted data streams
Benchmark Revisions
Political bias
revised May 2012
Professor Charles Anderson Bliss taught the Business Conditions and Cycles course when I attended the Harvard Business School. He was formerly with the National Bureau of Economics. His course and Professor Ralph Hidy's Business History course were the two most useful courses which I took at HBS.
Here are three of Professor Bliss's favorite sayings:
"Bad Data creates Bad Decisions!
"Faith in government statistics is often misplaced."
"You have to know what makes up the data series and how it is collected before you can make an informed decision based upon the series."
In looking at the enormous amount of economic information which exists and then trying to make conclusions based upon them for either policy or investment decisions is a major task.
We often forget to ask some questions when looking at economic data. Some of these are:
"Why is the information useful and/or needed?"
"Is the cost of obtaining the data proportional to its usefulness?"
"How much precision is required to make effective decisions?"
The most important data series that govern most economic forecasting are:
Gross Domestic Product or Gross National Product (GDP/GNP)
Unemployment Rate and Labor Force Size
Consumer Price Index and Producer Price Index (CPI/PPI)
The interchange between the various data series and projections thereto affect virtually every individual, business and government in a multitude of ways.
There are a number of complicating factors that statisticians use to adjust raw data which over time can vastly change historical comparisons. Some of these are:
|
Sample size and frequency of sampling | |
|
Raw data and changes in how it is collected | |
|
Seasonal adjustments | |
|
Hedonic Adjustments | |
|
Substitution Factors | |
|
Independently vs. dependently adjusted data streams | |
|
Benchmark Revisions | |
|
Political bias |
In this Opinion piece, we will look under the hood of the employment statistics. In subsequent Opinion's this year, we will examine GDP/GNP and CPI/PPI.

Do they really tell us anything? Each month, the Bureau of Labor Statistics in the U.S. Department of Labor prepares a report known as the "Employment Situation Summary" or the monthly jobs report. Detailed data is presented on the internet for each month.
In looking at the official employment statistics, it is important to understand that there are two different series that are important. They are:
Table A-1 - Household data which covers:
| |||||
Table B-1 - Establishment data which covers:
|
The Household survey measures the number of people who have jobs from a sampling of about 60,000 households each month. In the survey, people are classified as employed if they did any work at all as paid employees during the reference week; worked in their own business, profession, or on their own farm; or worked without pay at least 15 hours in a family business or farm. People are also counted as employed if they were temporarily absent from their jobs because of illness, bad weather, vacation, labor-management disputes, or personal reasons.
The Bureau of Labor Statistics collected the data on a non-seasonal basis which it reports. However, it applies seasonal adjustments to the data which is then picked up and published in the main stream media.
People are classified as unemployed if they meet all of the following criteria:
| they had no employment during the reference week; | |
| they were available for work at that time; and | |
| they made specific efforts to find employment sometime during the four week period ending with the reference week. |
Persons laid off from a job and expecting recall need not be looking for work to be counted as unemployed.
The official U-3 BLS unemployment rate for April 2012 was reported as 8.1% on a seasonally-adjusted basis and the following graph shows that data series from January 1994.
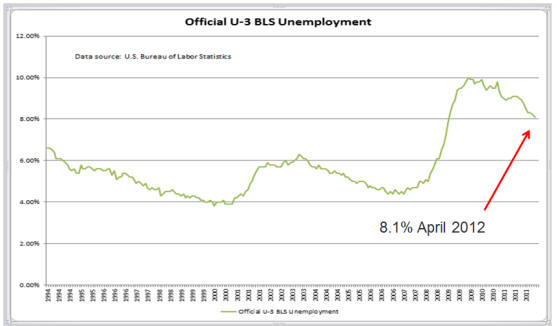
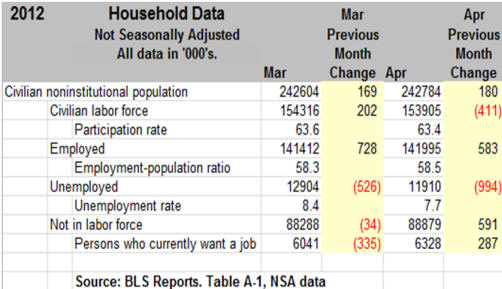
The raw non-seasonally adjusted data for the March-April 2012 period shows that the unemployment rate was only 7.7% in April. From the Obama Administration's perspective, would it not have been better to show the lower NSA rate rather than the seasonal rate of 8.1%?
Prior to the Obama Administration, the changes on a y/y basis of the seasonal adjustment delta in the number of employed were relatively low and constant. During the Obama Administration, the delta has become inconsistent as shown in the following chart.
We won't go into all the specifics of the alternative measures of labor underutilization as shown in Table A-15 of the Employment Situation report except to show the wide variation in the data as shown below.
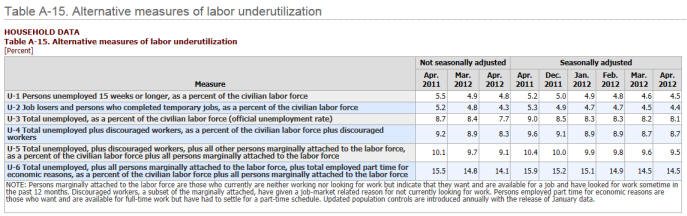
It is important to note that persons out of work for one year or longer are not counted as unemployed unless they are receiving unemployment benefits. Also, individuals who qualify for disability benefits after exhausting their extended unemployment benefits are also dropped from the ranks of the unemployed.
We have also noted in analyzing the data that there is no consistency in the amount of seasonal adjustments over time between years.
The U-6 series includes everyone except those who have been out of work for more than a year. The following graph shows the U-3 and U-6 unemployment levels on a seasonally-adjusted basis through March 2012.
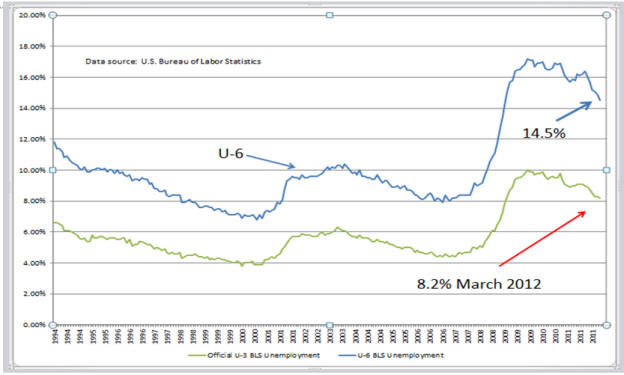
The U-3 (headline rate) and the U-6 data series are the ones which are generally discussed in the media.
Since the 1960's, there have been changes in the definitions of what it means to be unemployed. During the Kennedy administration in the early 1960's, unemployment was redefined with the concept of "discouraged workers" so as to reduce the popularly followed U-3 unemployment rate.
Up until the Clinton administration, a "discouraged worker" was one who was willing, able and ready to work but had given up looking because there were no jobs to be had. The Clinton administration in July 2004 dismissed to the non-reporting netherworld about five million discouraged workers who had been so categorized for more than a year. In other words, if you were out of work for over a year, you were no longer unemployed.
But what happens to the unemployment data if you calculate it like it was done before the Kennedy administration changed the definition of unemployment? That brings the discussion to the data prepared by John Williams of Shadow Government Statistics.
By including all discouraged workers and those receiving disability, the unemployment rate rises to 22.3% as shown in the following chart.
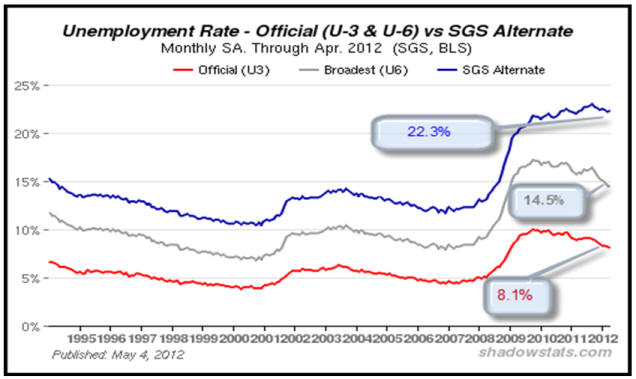
Which one of these unemployment levels should we be worried about?

The establishment survey is where the BLS obtains the number which is reported as the number of jobs added or lost in the economy each month. The survey is based on a monthly non-random sampling of payroll tax filings of about 141,000 corporations and government agencies counting jobs.
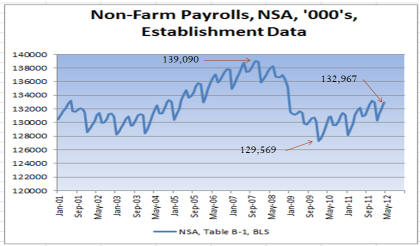
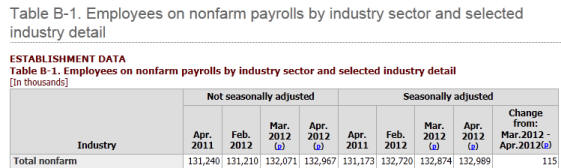
The raw data for total non-farm payrolls is reported in Table B-1 of the Employment Situation Report.
Employment peaked in November 2007 at 139,090,000 jobs. In July 2010, total non-farm payrolls fell to 129,569,000, or by 9,521,000 jobs. As of April's report, non-farm payrolls had risen 3,398,000 from the July 2010 bottom. However, to reach the employment level at the August 2007 peak would require an additional 6,123,000 jobs.
At the end of 2009, the U.S. Census Bureau estimated that the population was about 308.4 million. At the end of 2011, the population was about 310.5 million. Thus, to get the jobs number back to the previous November 2007 peak, will require about another 1.8 million jobs. To achieve the 80% "full-employment" level at the beginning of this recession as shown in the employment/population ratio chart below will thus require the addition an increase of about 7.8 million jobs.
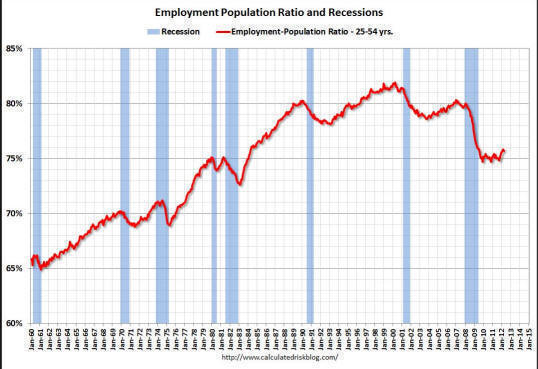
In April 2012, the BLS reported that total non-farm payrolls on a seasonally-adjusted basis added 115,000 jobs as shown below. Assuming that the economy can add 200,000 jobs a month, how many years will it take to get to "full employment" assuming an 80% employment-population ratio.
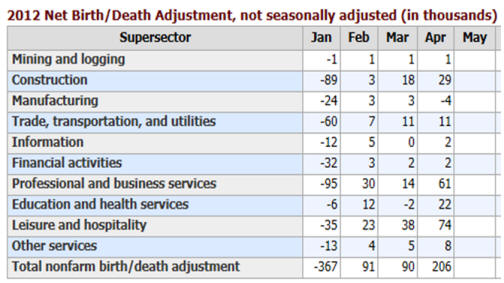
To account for changes in the economy, the BLS developed a fudge factor known as the net birth/death adjustment which is not-seasonally adjusted. In 2010, the fudge factor added 50% of all new jobs that were reported by the BLS. In 2011, the establishment survey reported 1,840,000 jobs added of which 490,000, or about 27% were accounted for by the fudge factor. The B/D A factors for 2012 through April 2012 are shown below:
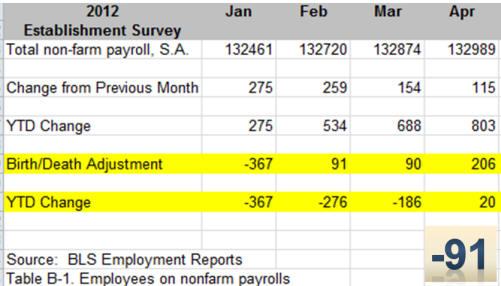
The birth/death adjustment can have a significant effect upon the reported number. The following table shows that effect. In the month of April 2012, total non-farm payrolls were reported to have increased by 115,000 but when you adjust for the 206,000 jobs of the fudge factor, the total non-farm payroll was actually showing a loss of 91,000. While this is not exact because the fudge factor is non-seasonally adjusted while the non-farm payroll is seasonally-adjusted, it does point up the slippery nature of the data.
| The household survey includes farm workers, the self-employed and workers in private homes, the establishment survey does not. | |
| The household survey counts people on unpaid leave as being employed while the establishment survey does not. | |
| The household survey is limited to workers 16 or older. The establishment survey is not age limited. | |
| The establishment survey counts jobs, making no adjustment for multiple jobs. The household survey only counts workers once. |
When you attempt to adjust for all the differences, the BLS has never been able to reconcile the two series within one million jobs.
Would not a different policy or investment decision be made if you believed the officially reported U-3 unemployment rate of 8.1% in April 2012 rather than the 22.3% as reported by John Williams of Shadow Government Statistics? Which rate seems best to resonate with your personal observations ... assuming you do not live inside the Beltway?
If it currently takes 6.8 million jobs to achieve an 80% "full employment" level, at the current rate of 115,000 jobs added per month, it will be over 60 months to get there.
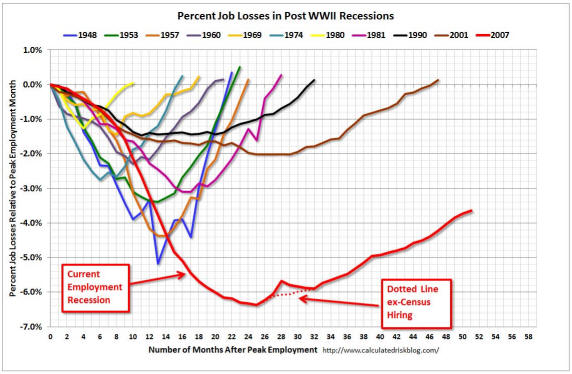
A real concern is how long it is taking to rebuild the economy despite all the stimulus programs. The following chart shows the current recovery versus previous recessions and it is not a pretty picture.
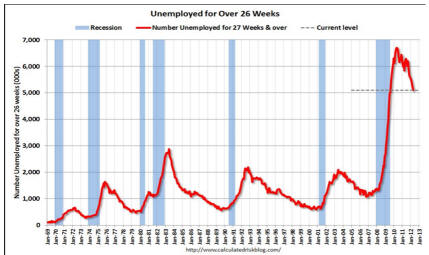
In fact, the current economic malaise might not have a "normal recovery" as uncertainties over Obamacare, increasing taxes and regulatory matters as well as structural employment changes and increasing usage of robots take root in the economy. The following charts shows the number of individuals unemployed for over 26 weeks. Clearly, we have not seen these levels before.
Despite many benefit programs which have been available to the unemployed, even the extended benefit programs are now shedding thousands of individuals per month.
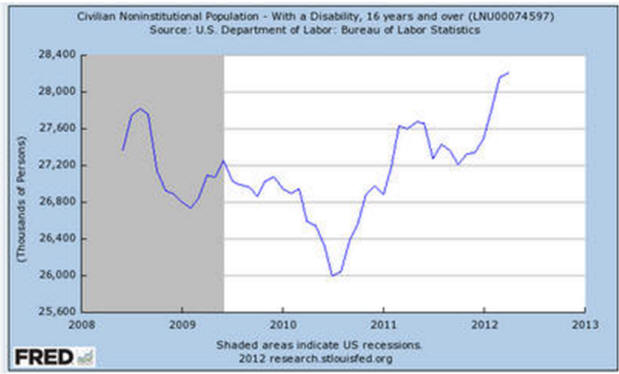
As a result, many individuals are now seeking to obtain disability status which removes them from the workforce as shown on the following chart.
The growth in the disability rolls has helped reduce the labor force participation rate as shown in the following chart.
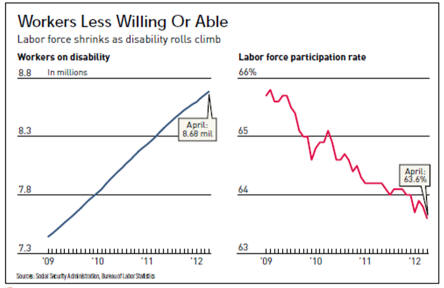
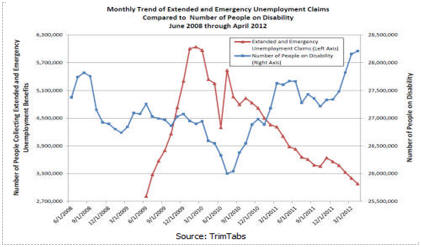
The interrelationship between unemployment benefits running out and the rise in people on disability is clearly shown in the following chart. As the unemployed lose their benefits, a significant portion of them are claiming disability which removes them from the labor force. You might say that they have merely exchanged one government dole for another.
It is very easy to accept the officially reported unemployment rate. On a near term basis, perhaps, there is a correlation between each quarter or year. However, on a longer time period, the various adjustments to the data can provide a misleading comparison.
It is important to understand how the raw data is compiled, how it is massaged and whether you are still looking at the same data series. After all, the BLS has been unable to reconcile its estimates of the number of people employed on a seasonal basis by a million individuals.
Perhaps, the BLS should undertake a review and get real time data using computers rather than making telephone calls and building speadsheets after wading thru thousands of randomly selected payroll tax filing reports.
Of course, that might put a few BLS employees out of work!
But then - 'Tis Only My Opinion!
Fred Richards
April 10, 2012
Corruptisima republica plurimae leges. [The more corrupt a republic, the more laws.] -- Tacitus, Annals III 27
This issue of 'Tis Only My Opinion was
copyrighted by Strategic Investing in 2011.
All rights reserved. Quotation with attribution is encouraged.
'Tis Only My Opinion is intended to provoke thinking, then dialogue among
our readers.
![]()
![]() 'Tis Only My Opinion! Archive Menu
'Tis Only My Opinion! Archive Menu
Last updated - December 20, 2009