![]()
Bad Data creates Bad Decisions
Did you ever wonder why your perception of the world around you differs from that presented by government data? If so, perhaps this article will help you understand why.
The Equity Markets
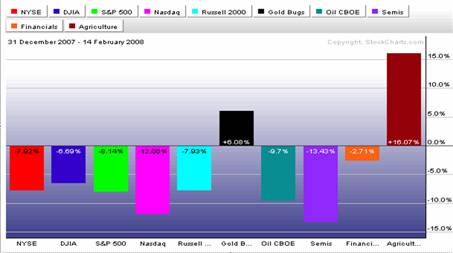
Let us look at the equity markets in the U.S. for the year to date. Since the 1st of 2008, only the precious metals and agriculture sectors have shown gains in their stocks as shown in the following chart. The Dow Jones Industrial Average was down 6.7% and the NASDAQ Composite 12.1%.
During this period, the Federal Reserve (FED) reduced the federal funds rate by 125 basis points in an attempt to jump-start the economy which had been buffeted by substantial losses in the financial system from sub-prime mortgage problems. The sub-prime mess was originally considered by the FED Chairman Bernanke and Treasury Secretary Paulson to be “contained.”
As the credit crisis deepened due to a change from the mark-to-model or market-to-make-believe valuations to mark-to-market valuations, financial institutions were threatened with violation of their credit ratios. Another aspect of the problem was the interwoven shareholder groups that controlled both the rating agencies as well as the bond insurers making the credibility of their ratings and ability to guarantee large amounts of bonds with little capital suspect.
The FED went back to its playbook and decided that it needed to decrease interest rates to help the financial system increase its earnings spreads and hopefully, earn its way out of the capital impairment problem over time while raising additional capital from both domestic and foreign sources to repair the damage to their capital structures.
The FED was more interested in retaining growth and was not concerned about rising inflation. It was willing to let the dollar fall if the spread between overseas interest rates and U.S. rates widened. Pressure was brought to bear on other central banks to help keep the spread down but the ECB was unwilling to help.
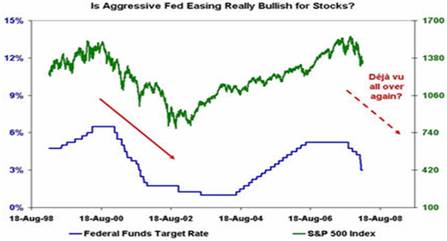
Investors believe that if the FED cuts interest rates equity markets will increase. However, the following chart shows that correlation is incorrect. As the FED cuts rates, the S&P 500 declines. As the FED raises rates, the S&P 500 goes higher and the increase often precedes the rate hikes.
Stock markets move in cycles. Should you be concerned about the market? However, the question facing most investors is where is the economy along the cycle as illustrated in the following chart.
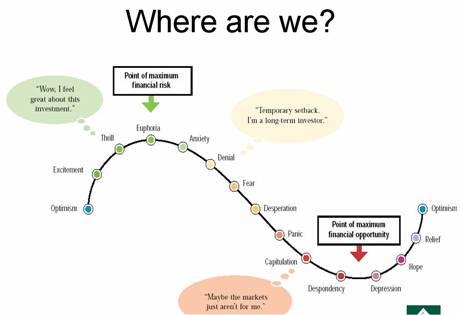
Most investors today will probably consider that we are somewhere between anxiety and fear. Quite frankly, they are probably making that decision listening to the government’s spin on economic data. Very few are ready to admit that the markets are somewhere between fear and depression.
Looking at markets
Thus the question is where are the markets now and where are they headed? We will try to look at the current situation. The next two charts show the S&P 500 and the NASDAQ Composite for the last eleven months.
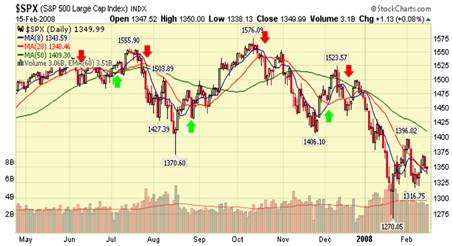
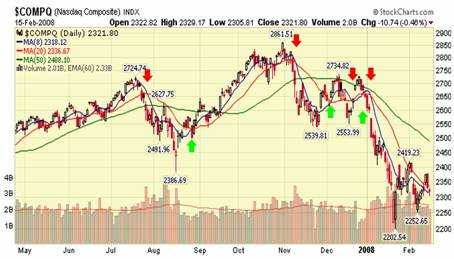
Both indices are apparently in a consolidation phase but are showing a negative Simple Timing Indicator (STI) signal. The STI is an 8 x 20 day simple moving average. From their highs in October 2007, both indices are close to meeting the classic definition of a bear market which is a drop of 20% from the high.
During the past few years, investors have looked at investing in overseas markets. ETF’s have been developed to allow investors access to those markets. Certainly, the decline of the U.S. dollar has helped increase interest among investors. The next three charts will show the major overseas indices.
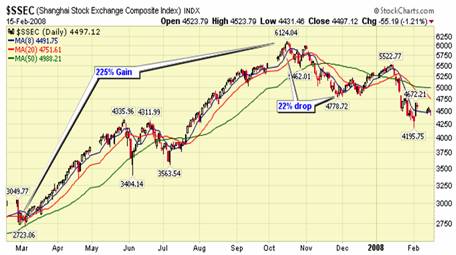
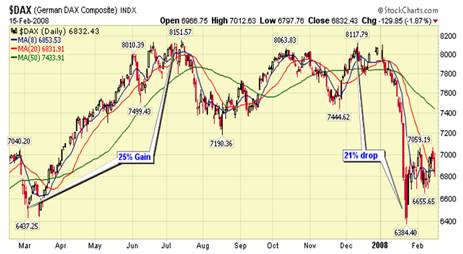
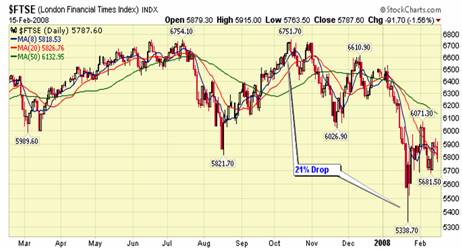
As you can see, the Shanghai index had a huge gain in 2007 but has since dropped about 30% from its December high. Both the German DAX and London FTSE did not have the large gains China enjoyed during 2007 but both have dropped about 21% from their recent highs. As a result, all three indices meet the classic definition of a bear market.
Now let us look at the Dow Jones Industrial Average (DJIA) which most market guru’s and media types comment on daily.
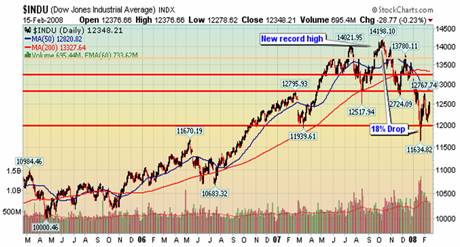
From its all-time record high in October 2007, the DJIA has fallen over 18% but has since recovered so that today it is only down 12% from that record high. Clearly, the DJIA has been the better performer of the six indices since October 2007.
Globalization
Since the 1980’s, one of the major factors influencing the world economic picture has been the growth of globalization. Its impact upon the U.S. is now beginning to be realized that perhaps the citizens of the U.S. are now worse off than ever before. I will only touch on some of those aspects of globalization that have impacted negatively the U.S.:
· Production of wealth has moved to lowest cost areas. Service-oriented economies consume wealth and do not produce it according to Adam Smith.
· As the U.S. has lost high-paying manufacturing jobs to lower-cost areas, the average labor rate in the U.S. adjusted for inflation has fallen resulting in a lower standard of living.
· The U.S. Consumer to maintain his standard of living has increased his consumer credit debt and reduced the amount of home-owners equity. While in many areas, housing rose faster than the cost-of-living thus creating an increased wealth effect as housing price bubble bursts, the consumer will be forced to reduce consumption.
· In the U.S, interest rates are now significantly below the official CPI numbers resulting in an inverted world of negative U.S. interest rates.
· If speculators begin to see that it is possible to borrow funds in the U.S. at low interest rates and reinvest those funds overseas at higher interest rates, the carry trade will cause the dollar to go lower in value.
· As the dollar falls, its role of U.S. as the world’s reserve currency will diminish and the ability of the U.S. to finance its twin deficits of trade and government will become increasingly costly.
Comparative World GDP
The economy of the U.S. still is the world’s largest. The World Bank in 2006 published data on world GDP which is shown below.
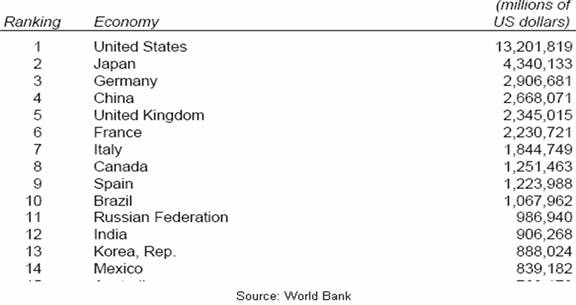
In 2007, China moved slightly ahead of Germany into 3rd place according to World Bank preliminary estimates. In 2007, the U.S. increased about 3% while China grew at 11%.
For 2008, the current estimate is that China will grow about 9% whereas the U.S. is estimated to grow less than 3% according to the White House forecast and even lower according to the FED.
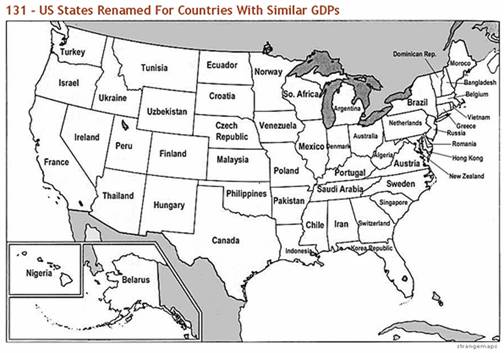
The following map of the U.S. from Strangemaps.com shows a comparison of the GDP of U.S. states versus various nations throughout the world. It does provide an interesting perspective about the strength of the U.S. economy vis-à-vis the world.
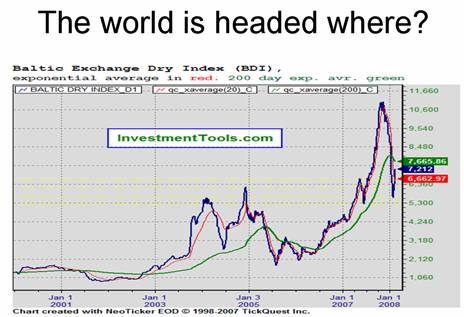
When investing either overseas or in the U.S., it is important to have some idea of where economies are moving. Since goods are moved from the country of origin to where they are consumed, the cost of moving goods is often a good indicator of overall economic activity. Within a country, an index of freight shipments and/or truck tonnage is useful. For the world as a whole, the Baltic Dry Index provides a clue about economic activity. When the Baltic Dry Index is up, economic activity is moving higher and the reverse is true. The Baltic Dry Index is now off significantly from its October 2007 high as shown below:
The US Economy
According to the Wall Street economists and official government data, there is a possibility of a recession occurring in 2008. According to these sources, the following points are true:
• GDP growing at less than 3%
• CPI growing at 4.2%
• Fed Funds 3%, 10 year Treasury 3.5%
• Unemployment 5.0%
• Housing industry near bottom
• MZM growing at 12.3%
• Federal Deficit $162.8 Billion in FY 2007
Official commentary from the FED, the Department of Treasury, the White House, the Bureau of Labor Statistics and various other government sources suggest the following:
• Sub-prime mess is being contained
• The FED will continue to cut rates
• $3.1 Trillion budget is manageable
• Increasing debt levels no problem
• U.S. dollar weakness helps exports
• $165 Billion stimulus package will prevent a recession
• Inflation is not a problem
• Retail sales increased in January 2008
Everything that was just stated above about the state of the economy is false!
The statistics shown above do not present the real world and suffer from the use of seasonal, hedonic and revisions to methodology to create a false sense of the economy. The manipulation of data has occurred consistently over the past 30-40 years so that any comparisons result in apple-orange results.
The real problem is that many of our politicians, analysts and citizens actually believe the data presented. As a result, decisions which they make are often bad decisions.
In fact, the FED and the Administration talk about transparency of data and then find reasons to either eliminate information on the money supply (M3) or remove access to Information where valuable information can be readily found because of budget constraints or on the basis of possible national security concerns.
When data does not meet expectations or if the CPI is getting high, revisions are often made to the input data. The CPI methodology has been changed at least 14 times since June 1996. Does that sound like an apples-oranges comparison?
The Real U.S. Economy
If you felt that your reading of the economy was different from that of Wall Street and/or the official figures, you were correct. Here is the real world economic data:
· Recession began in 4th Qtr 2004
· Housing might not recover for years because prices will continue to fall as foreclosures increase. Also, in 2008, option ARM’s will begin to reset rates.
· Real unemployment rate 9.9% Line U6 of Table A-12 Employment Summary
· GDP growth in 2007-2.2%/yr
· CPI +11.9%
· M3 increasing at 15%
Compare the real world to the official data … which do you believe?
The Federal Reserve
The FED was organized in 1913 to facilitate the economy and to control inflation. At the time of its founding, a U.S. dollar could be converted into either gold and/or silver. Today, it is only a fiat currency and subject to the whims of opinion as a medium of exchange. Many economists suggest that the FED has done a great job of controlling inflation, assisting growth and managing the money supply making the U.S. economy the world’s largest.
The following chart shows the decline in value of the U.S. dollar since 1900 and the increase in the cash budget federal debt though 2007.
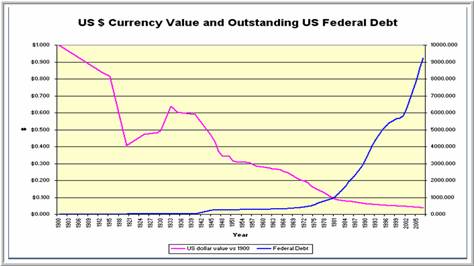
The U.S. dollar is now worth less than 3 cents in terms of 1900 dollars whereas the formal cash budget of the U.S. federal debt is over $9 Trillion. If that is considered to be “good performance”, I am sure glad that the FED was not giving us “poor or average performance.”
We can not blame the FED and its foreign ownership for all of this carnage as politicians without the stomach to raise taxes and giving entitlements for votes along with military costs have also been responsible. The seven years of the George W. Bush administration has doubled the debt.
Although the FED ceased publishing M3 data last year because of “cost concerns”, independent economists have been able to provide M3 data independently. According to both Shadow Government Statistics (SGS) and nowandfutures.com, M3 has been rising at historic rates as shown below in the chart from SGS.
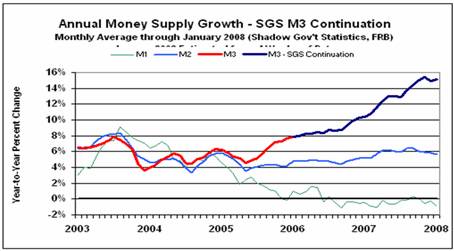
With the money supply running in excess of 15%/year, it is of little wonder why the FED would not want to draw attention to the increase. Inflation is often defined as an increase in the money supply beyond the increase in GDP. In 2007, if GDP only increased about 3% and M3 increased 15%, the inflation rate should be about 12%. Certainly, that is higher than the 4.1% reported in the 4th Quarter.
Inflation and the CPI
According to the Bureau of Labor Statistics, long-term inflation in the U.S. has been running under 3% as shown in the following chart.
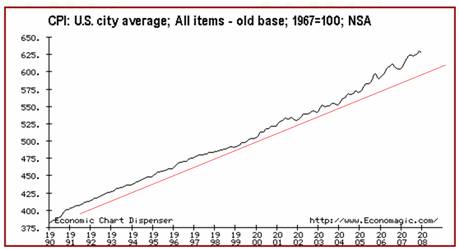
Since 2005, official government data as shown above appear to be accelerating away from the long-term trend line. Of course, the multiple changes in the methodology have been able to moderate the acceleration since 1996. Almost every change of methodology has resulted in a decrease to the CPI number.
SGS has tracked all those changes and the following graph vividly illustrates the differences over time since 1980 of the changes.
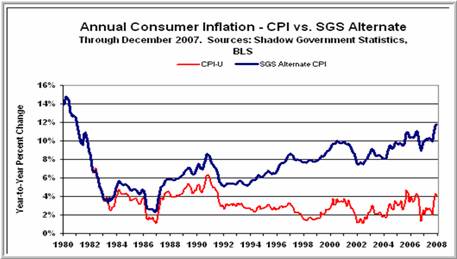
As we showed above in the growth of money supply, inflation appeared to be running about 12% in 2007. The SGS chart confirms that conclusion. I’ll bet it will also coincide with your wallet data.
The Consumer Price Index
The Consumer Price Index is eagerly awaited each month and depending upon the number, it can move markets for a period of time. The FED and talking heads along with Wall Street often focus upon the Core CPI data as it eliminates the recent volatility in energy and food. Of course, our citizens have found a way to not eat, heat or air-condition their offices and drive.
Core CPI excludes energy and good and the FED often quotes core CPI as the reason for its decisions. Within the FED, there are two groups that have developed additional measurements of CPI as they do not think the BLS data accurately reflects the real world.
The following two charts shows why the government does not want you to focus upon real CPI data.
SGS has developed from official sources other than the two noted above, various estimates of annual inflation. The range between the sources is simply mind-boggling.
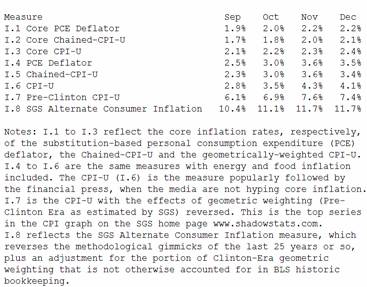
As I said before when you make decisions upon bad data, you often make bad decisions.
The U.S. Debt Picture
The true debt of the federal government is beyond the ability of its citizens to pay as revealed by David Walker, the just-resigned Comptroller of the Currency. The following chart shows the true state of the U.S. federal debt.
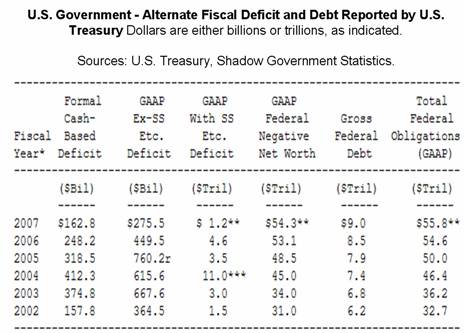
The formal cash-based federal deficit for fiscal 2007 was stated to be $162.8 billion down from the $248.2 billion in FY 2006. There was probably a good deal of window-dressing in that number as two business days after the September 30th close, the federal debt was higher by $62.2 billion whereas the average daily increase was only about $450 million ($162.8 B /364 days) in FY 2007. If you add the $60 billion to the reported $162.8 billion, it does not look like a major reduction in the formal cash-based federal deficit occurred in FY 2007. Does that sound like Enron accounting to you?
The real kicker is the Total Federal Obligations (GAAP) deficit of $55.8 trillion at the end of FY 2007. The GAAP deficit increased $1.2 trillion in FY 2007. With a population of slightly over 300 million, that is a debt of about $186,000 for every U.S. citizen.
U.S. Gross Domestic Product
John Williams of Shadow Government Statistics has been able to restate the multiple changes in various governmental data streams to remove hedonic, seasonal and revisions so that comparable data can be utilized. The following two graphs show the official GDP data as well as the uncloaked GDP from 1980.
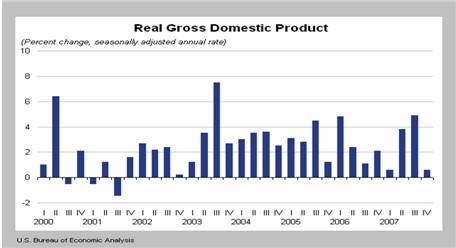
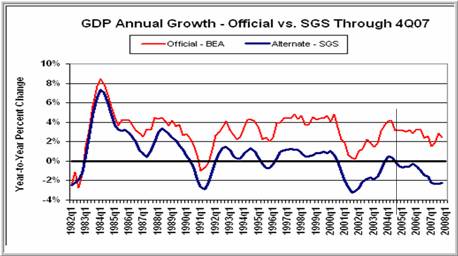
The use of hedonic adjustments has largely accounted for the difference between the two numbers. For example, the Bureau of Economic Analysis (BEA) uses the higher CPU speeds of computers to justify increases in GDP beyond what the sales of computer manufacturers would actually report.
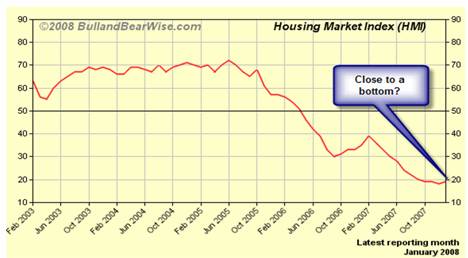
The Housing Bubble
The deflated U.S. housing bubble has caused a substantial reduction in home-owners equity. Many of the sub-prime borrowers and no-doc mortgages are now showing negative equity positions. As a result, lenders are facing increased delinquency rates, higher foreclosure rates and decreased resale prices. The real estate market has become a closed loop of deteriorating wealth feeding upon itself.
The NAHB housing market index shown below clearly shows the decline in the real estate sector. Housing starts are now less than 50% of the peak of 2006 and inventories of unsold homes remain at record highs.
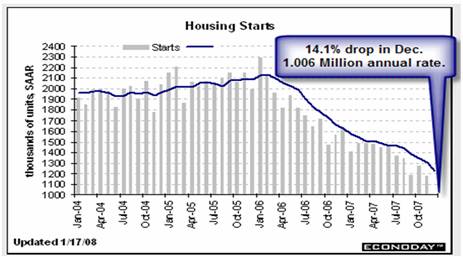
With foreclosures increasing, it will be some time before prices stabilize as banks do not want to own declining assets.
One of the problems of the mortgage rating models was that they believed that when home-owners got into trouble, the last thing they would do is not pay their mortgage. Unfortunately, they failed to realize the number of homes which were financed as second and third residences and/or flips. When consumer began to get strapped because of falling housing prices along with soaring food and energy prices, the default rate on those second and third residences and/or flips increased.
If wishful thinking could help, the housing market would not continue to deteriorate. However, it is my belief that with financial institutions increasing lending standards and faced with capital constraints caused by losses resulting from the sub-prime mess and the rolling effect upon other classes of securities that it will be 2010 before the bottom is found. Housing prices could deteriorate another 20% which is just reverting to the mean in many areas. However, if history is any guide, prices revert below the mean before the bottom is found.
Retail Sales and the Consumer
In January 2008, retail sales growth did not keep up with inflation. In fact, as food and energy prices have risen the past two years, the change in retail sales exclusive of autos and gas has been in almost a free-fall as shown in the following chart.

A look inside the retail sales data shows where sales are up and down as shown in the following table.

With gasoline up 23%, it is little wonder that the government wants to highlight core CPI.
Employment
Employment in the U.S. continues to be anemic as globalization continues to remove manufacturing jobs from the U.S.
The seasonally-adjusted (SA) unemployment rate trumpeted by the BLS was 4.9% in January 2008. Of course, the real SA unemployment number was considerably higher at 9.0% as revealed in Table A-12, Line U6 of the January Employment Situation Summary report known as the Household Data report.
Due to the inability to count workers by the BLS, the household data is adjusted by what is termed a Birth/Death Rate adjustment factor to account for jobs which might not be counted for a variety of reasons. In 2007, the Household Data report showed a SA increase of only 285,000 jobs in the U.S. The fudge factor known as the Birth/Death Rate adjustment accounted for 1,130,000 jobs as shown in the following table.

The U.S. Economy is in trouble
With the problems facing the housing and financial sectors, soaring food and energy prices, and the continued loss of manufacturing jobs, the U.S. economy continues to struggle. The only solution for the FED is to “inflate or die” as it has basically lost control of the world financial markets.
We currently have the Treasury marketing 10 year bonds at rates which are below the officially-sanctioned inflation rate. It is simply amazing to me how investors both here and abroad continue to purchase the U.S. Treasury offerings.
The Michigan Consumer Sentiment report for the U.S. is dropping as shown in the following chart. What is also interesting in the chart is the close correlation between the S&P 500 when deflated by the priced of gold and the consumer sentiment data.

Despite all the efforts by the FED and other central banks to prevent the price of gold to move higher, apparently consumers have become sensitive to the relationship.
Factors affecting the Economy going forward
In trying to assess future investment opportunities, we have to understand where we are. Investment decisions will be affected by many factors including:
· World credit crisis from sub-prime fallout
· Mark-to-model no longer acceptable
· Commercial paper market freeze
· Bailout of Banks both domestic and overseas
· Election year in U.S. and changes to tax laws
· Derivatives imperil financial markets … who is the ultimate counter-party?
As decisions are made to both preserve and grow capital, the fiat dollar of the U.S. will be of major concern.
The dollar’s role as a reserve currency will continue to deteriorate unless the trade and federal deficits are reduced. The political will in the U.S. to undertake the necessary changes in fiscal and monetary policy to continue its reserve currency role is lacking.
The recent reluctance of foreign investors to continue to finance Treasury offerings can be seen in the latest 10 year bond offering where only 10.7% was purchased by foreign interests. As the dollar declines, central banks have also begun reducing their holdings of U.S. securities.
The international oil trade formerly traded almost exclusively in U.S. currency has begun to trade in both Euro’s and gold equivalents. In addition, the opening of the Iranian Bourse to trade commodities will begin to affect trade among the Islamic producers.
The following chart shows the U.S. index at new all-time record lows with a $400 billion federal deficit on tap for FY 2008.

With the large write-downs at financial institutions of about $130 billion in the U.S. and more overseas, the effect on world-wide liquidity has become evident. The FED has not pumped as much money into the system as the ECB but the losses may be higher in overseas financial institutions. Wall Street which pitched these instruments as safe based upon AAA ratings is finding that their credibility among foreign institutions has suffered.
Within the U.S. the $130 billion loss has created severe strains and led to the Term Auction Facility (TAF) to help banks stay solvent. The TAF is supplying 30 day paper on collateral other than U.S. Treasuries in the amount of $50 -$60 billion every two weeks. Between the repo’s from both the FED and the U.S. Treasury, there appears to be some $225-$250 billion of short-term support being supplied to the Plunge Protection Team (PPT) to stave off a further collapse in the equity and bond markets as today.
Still despite these cash infusions, the net borrowed reserves at the FED have gone into negative territory for the first time since the 1930’s as shown in the following chart.

Still despite all this support, last week saw investment banks refusing to commit their own capital and allowing the municipal auction market to fail. During the week over 100 muni auctions failed including the Port of New York Authority which saw its interest rate soar to 20%. Now the world is on notice that the word of Wall Street is no longer to be trusted.
Debt is a problem
The U.S. has leveraged its economy so that a contraction in debt creates an economic recession, if not, worse. A quick look at some debt statistics follows:
· US Federal Government Liabilities $53 T 9-30-2007
· GSE’s have $4.7 T insured versus $82 B in capital
· Monoline insurers have $35 B after new money versus $2.5 T of insured assets.
· About $135 B of sub-prime written off, another $800 B remains … maybe, Japan? The Japanese banks will have to report as of March 31st.
· UBS says another $230 write downs coming for banks.
· In 2005, US consumers borrowed $2.9 T in new home loan debt. The refinancing ATM which was used to continue spending has been effectively closed.
· Median home price fell to $219M in December vs. $244.7M a year ago.
· $69 B in cash infusions to US financial institutions during the last ten months and they are still insolvent.
And stacked up against the U.S. debt is an economy with a total GDP of only $14 Trillion. It looks like a long struggle is ahead to return to solvency for the U.S. The following chart of the S&P 500 deflated by the price of gold shows a 70% drop since the 2000 peak of the index.

As globalization has moved production overseas, the U.S. consumer is now responsible for providing about 70% of the U.S. GDP. As the consumer sees average wages headed lower along with increasing prices for food and energy, the only solution is to cut back spending.
Moreover, U.S. dollars when measured by the price of gold have taken a major beating during the same period as shown in the following chart. Since the peak in 2001, the USD:Gold ratio has fallen 83%. The fiat currency is in free fall.

Current Comments
Since the first of 2008, the U.S. dollar has traded in a relatively narrow range while the price of gold has continued to move higher as shown in the following charts.


Historically, an increase in the price of gold of $150/oz would have seen a significant drop in the value of the U.S. dollar. It is apparent that recently we have seen a change in the historic relationship. The cause of this disconnect is not immediately clear. One possibility is that the U.S. dollar is receiving unusual support from the FED and other central banks. Another possibility is that the losses in the financial markets are significantly greater in both Europe and Asia. As a result, the dollar is considered a better safe haven than currencies elsewhere.
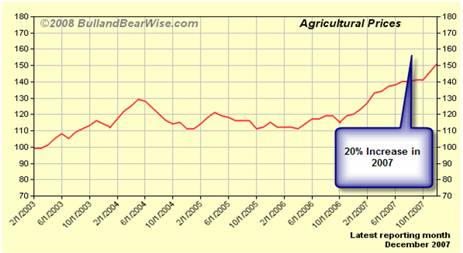
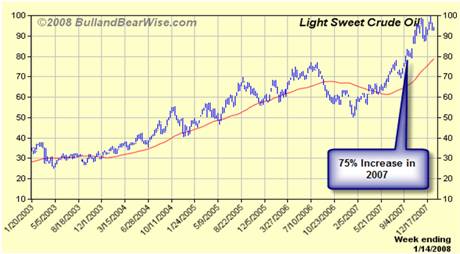
During this same period, the price of many other commodities has been also rising at a significant rate as shown in the following table.
|
Commodity |
Percentage |
|
Heating Oil |
4.2% |
|
Natural Gas |
19.9% |
|
Unleaded Gas |
4.4% |
|
Aluminum |
10.6% |
|
Copper |
22.4% |
|
Silver |
10.9% |
|
Platinum |
29.9% |
|
Coffee |
14.0% |
|
Corn |
14.9% |
|
Wheat |
15.3% |
|
Soybeans |
16.6% |
These commodity price increases will cause inflation in the U.S. to move even higher in the near future.
The Best Scenario
If the U.S. is lucky, the best scenario for investors is as follows:
· Economy muddles-through
· Market does not go below DJIA 11500, S&P 1275, NASDAQ 1900
· Dollar index below 72
· Corporate profits do not fall 10%
If this occurs, we might see the market moving sideways for the next year at which time tax and spending programs from a new Congress and President will begin to affect the outlook.
Since both Democratic potential nominees have plans to increase spending and taxes if elected and with the Democrats probably increasing their hold on the Senate and House, investments with substantial gains should be carefully reviewed to determine if they should be sold.
I would give this scenario about a 10% chance of working.
The Most-Likely Scenario
I rate the following as having about an 85% chance of occurring during the rest of 2008.
· Foreign investment in the U.S. declines further causing interest rates to rise significantly at the high end of the rate curve.
· Consumer spending drops at least 10%
· Dollar index below 70
· Real Inflation moves to 20%
· M3 above 20%
· Housing falls another 15% or more
· Federal deficit exceeds $500 B, GAPP $4.5 T
I would expect bankruptcies to occur among specialty retail chains, investment banks, large home builders and suppliers to the housing market. If the credit insurers lose their AAA ratings you should expect a major upheaval in the price of many bonds.
With the FED able to generate electrons without substance, it will continue to supply funds to prevent the bankruptcy of major money-center banks even though they are probably insolvent based upon their Tier-2 and Tier-3 outstanding loans. The real risk to the system is if overseas investors and governments decide that it is not worth risking further capital for the limited return of a depreciating currency.
With both Japan and China dependent to an extent upon the U.S. economy, a decision to sell down their holdings of U.S. Treasuries will probably be gradual. However, only about 19% of China’s exports were to the U.S. in 2007. A move to drastically reduce China’s holdings would most likely take place only if the decision is made to wage total economic war.
So where do you invest?
If you are in the U.S., cash should be maintained in another currency. Investors should not be chasing yield but capital safety.
One of the major problems which will not change is the increasing need for food as world populations grow. Hence, investments in prime agricultural land and industries will probably fare reasonably well. Also, some technology companies might also benefit. There will always be companies that do better than others. The trick is to find them.
In closing, let me remind you of something one of my mentors drilled into me. When measuring anything, make sure that you are aware of the yardstick you use. By using the wrong yardstick or looking at bad data will provide you with a bad decision.
In the final analysis, it is an increase in purchasing power that investors are seeking. Be careful out there.
But then - 'Tis Only My Opinion!
Fred Richards
February 2008
Corruptisima republica plurimae leges. [The more corrupt a republic, the more laws.] -- Tacitus, Annals III 27
This issue of 'Tis Only My Opinion was
copyrighted by Adrich Corporation in 2008.
All rights reserved. Quotation with attribution is encouraged.
'Tis Only My Opinion is intended to provoke thinking, then dialogue among
our readers.
![]()
![]() 'Tis Only My Opinion! Archive Menu
'Tis Only My Opinion! Archive Menu
Last updated - July 10, 2008