'Tis Only My Opinion!
December 2004 - Volume 24, Number 12
![]()
![]()
Looking back at Outlook 2004. |
|||||||||||||||||||
|
If you were wondering about the quality of our predictions for 2004, we will reprise them for you.
Did you do as well?
|
|||||||||||||||||||
Laying out the Puzzle |
|||||||||||||||||||||||
| Before we can put together a good view of the world’s and
the U.S. economy in 2005, we need to look at some macro data that might impact
our conclusions. The atmosphere which supports life on Earth is relatively shallow. While many pseudo-scientists have worried about holes in the atmosphere and global warming one decade and global cooling earlier, the history of earth shows that nature through earthquakes, volcano eruptions, and floods have caused greater and more lasting changes to the earth’s surface than man.
This NASA composite photo shows the concentration of population throughout our planet as well as the industrialization zones. The existence of light can be found in areas where homo-sapiens have congregated.
|
|||||||||||||||||||||||
Relative GDP around the World |
|||||||||||||||||||||||
|
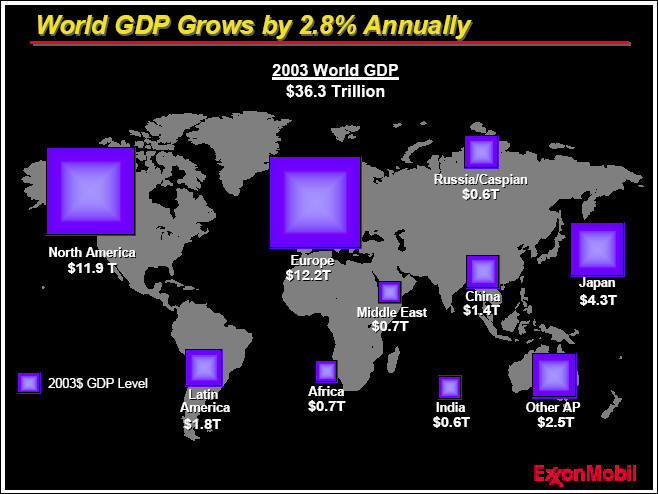
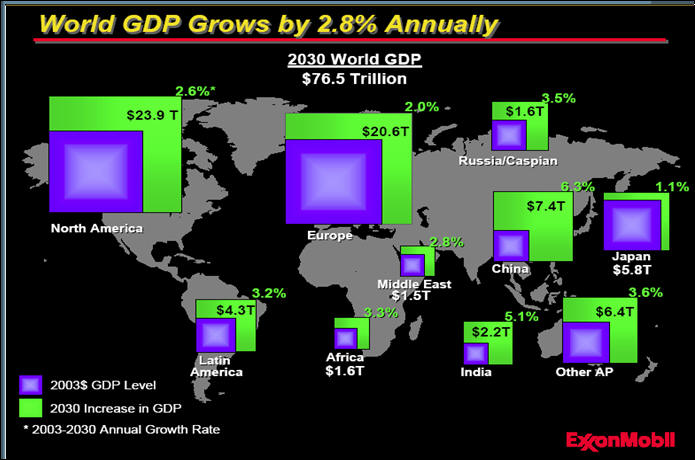
We want to thank ExxonMobil for their charts. This chart shows in 2003 dollars the GDP of the major trade zones of the world. They have recently prepared an excellent report on world energy demands for the future which can be accessed on their website at www.exxonmobil.com. The report extrapolates energy demand to 2030. Exxon anticipates that world GDP will grow at 2.8% annually through 2030. While I don’t totally agree for reasons we will discuss later, the next chart shows the relative growth of economic zones. Note that China is expected to have the largest increase in GDP during the period.
|
|||||||||||||||||||||||
World Population Growth |
|||||||||||||||||||||||
|
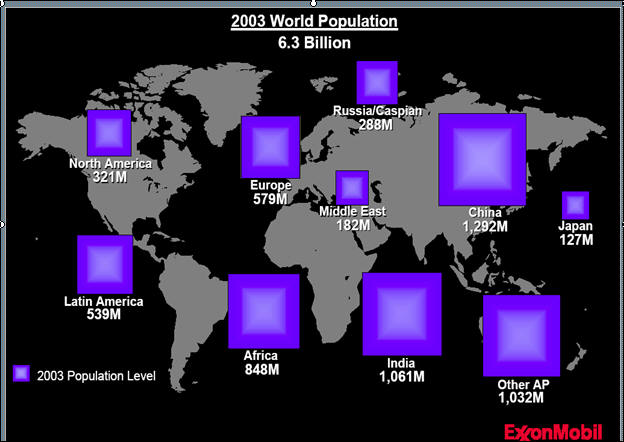
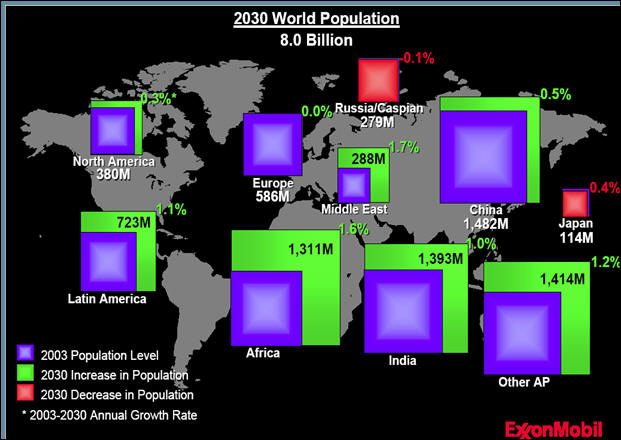
One of the major driving forces of economic growth is population. This chart depicts the worlds population in 2003. Note that China has about 4 times the population of North America which includes Canada. Latin America numbers includes Mexico south and South America. By 2030, we will see dramatic population changes throughout the world according to ExxonMobil. This is a place where I believe that we begin to have a different interpretation of future changes. But let’s examine Exxon’s numbers anyway. Growth in North America and Europe is almost zero while the Russia/Caspian and Japan zones turn negative. Surprisingly, China’s efforts at controlling population are expected to keep its population nearly level.
|
|||||||||||||||||||||||
World Energy Demand |
|||||||||||||||||||||||
|
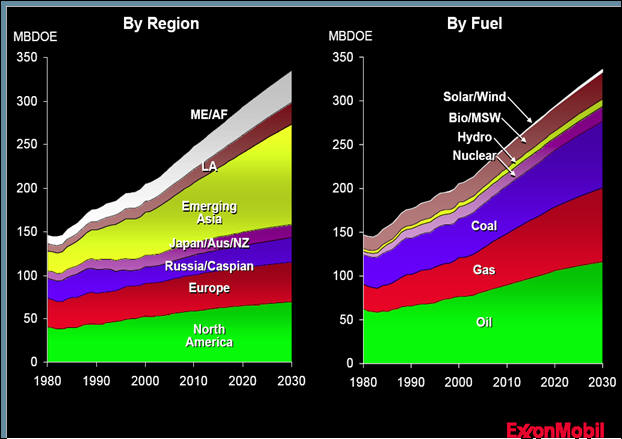
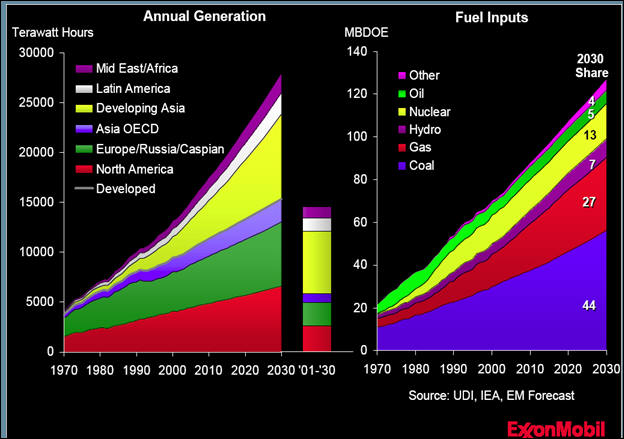
During the past two centuries, economic growth has been dependent upon the availability and cost of energy. This chart shows the growth of energy by region and by fuel as well as the growth expected by oil economists. Asia which includes China is expected to be the largest growth area for energy in the next 25 years. While coal is expected to continue to increase market share, the area of natural gas and oil represent the largest growth areas according to the oil economists.
|
|||||||||||||||||||||||
Where the Hydrocarbons are located. |
|||||||||||||||||||||||
|
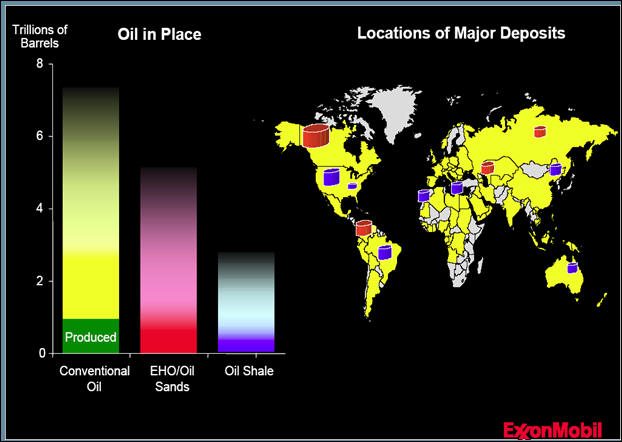
This is a world map of the location of hydrocarbon deposits. According to this chart, there remains a lot of hydrocarbon deposits on this planet. The real question is one of the cost of extraction and conversion to a usable form of energy. As oil approaches the $50 level, the extraction of oil from oil sands and oil shale become viable alternatives.
|
|||||||||||||||||||||||
World Gas Demand |
|||||||||||||||||||||||
|
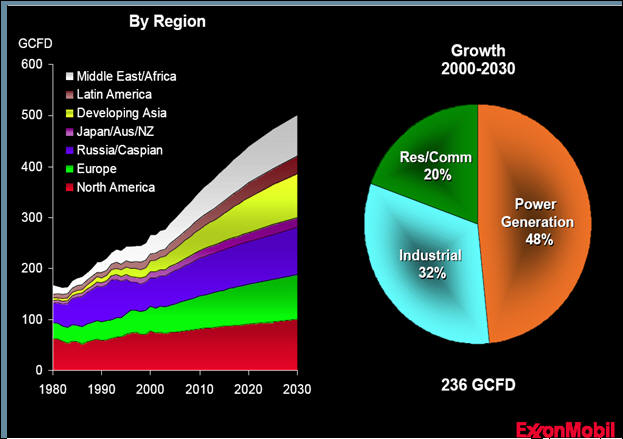
This chart depicts gas demand throughout the world. Note that power generation takes almost ½ of total gas demand. In the last decade, this is a significant increase as the environmentalists have caused a change from coal-fired power plants to gas-turbines. Many chemists are incensed at the use of natural gas for power generation as there are many products which can only be made from natural gas and/or its compounds. There is one development that could change the ExxonMobil forecast. The DOE has initiated a project for a small nuclear reactor (SSTAR) that could reduce significantly the use of coal and gas-turbine generators and increase the safety aspect of nuclear facilities also.
|
|||||||||||||||||||||||
Liquid Natural Gas (LNG) Usage is Growing |
|||||||||||||||||||||||
|
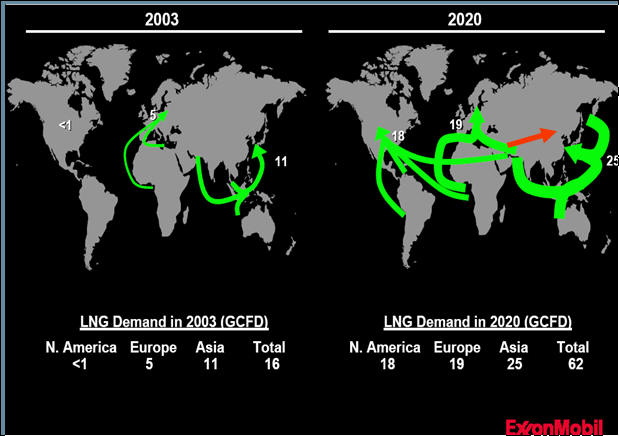
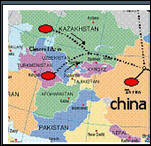
Many analysts have also focused upon the possibility of using LNG as fuel. However, gas fields are not co-located with areas of demand. The picture on the left represent the current flows of 16 GCFD of LNG into markets in 2003. The picture on the right illustrates the growth to 62 GCFD of LNG to market in 2030 almost a four-fold increase. The cost of transportation using LNG tankers and terminals or in the case of China/Iran, an LNG proposed pipeline, is a significant portion of the cost of the fuel. The red arrow shows the proposed pipeline from Iran to China recently announced. As the chart shows, the ExxonMobil people expect a significant increase in LNG shipments within the next 16 years. When the ExxonMobil report was prepared, the just announced LNG pipeline between Iran and China that is expected to move at least $100 Billion of LNG in the next 25 years had not surfaced. Some analysts expect that the more realistic value to the LNG pipeline will be about $200 Billion in the next 25 years. In exchange for building the pipeline, the Chinese also got development rights to some of the Iranian oil fields.
|
|||||||||||||||||||||||
Power Generation Growth |
|||||||||||||||||||||||
|
Power drives economic growth. Without the availability of adequate supplies, economic engines stall. This chart shows the growth expected of power generation by type and area through 2030. The highest growth is expected to be in Asia with the growth in Europe and North American continuing along the current path. The oil industry expects that hydro-carbons will remain the major fuel source in the next two decades. One might reasonably ask . . . Is this realistic given the current political and environmental mindset? Also, given the political threats in the Middle East can gas and oil be relied upon as sources of cheap energy? Nuclear Energy is expect to grow in the next 25 years. However, will nuclear be allowed to provide electricity in the future?
|
|||||||||||||||||||||||
Where the Nuclear Plants are. |
|||||||||||||||||||||||
|
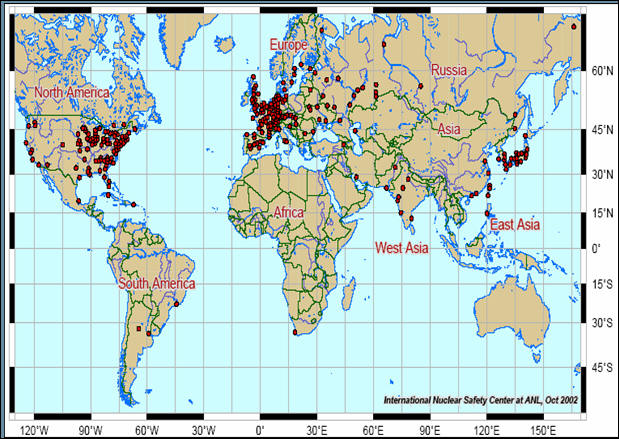
This map shows the location of all fixed-location nuclear power plants. As of 2003, we had over 400 operating power plants at fixed locations. For nuclear power plants designed by U.S. and Western Europe companies, there have been extremely few incidents since nuclear energy began producing electricity. Among the Russian poorly-designed early plants, only Chernobyl presented a fatal problem. Because of an instrument failure, the West had one runaway that was contained with radiation doses which led to 2 deaths in Japan. The number of workers killed building the nuclear power plants dwarfs those dying in the West after the plants went on stream. Estimates of nuclear power Naval vessels are classified. However, based upon several sources, one analyst suggests that there are more than 3000 nuclear power generating plants that have operated successfully in naval ships and facilities throughout the world.
|
|||||||||||||||||||||||
The Demographic Issue |
|||||||||||||||||||||||
|
Here are a few factors that threaten the Western way of life.
|
|||||||||||||||||||||||
Population Replacement |
|||||||||||||||||||||||
|
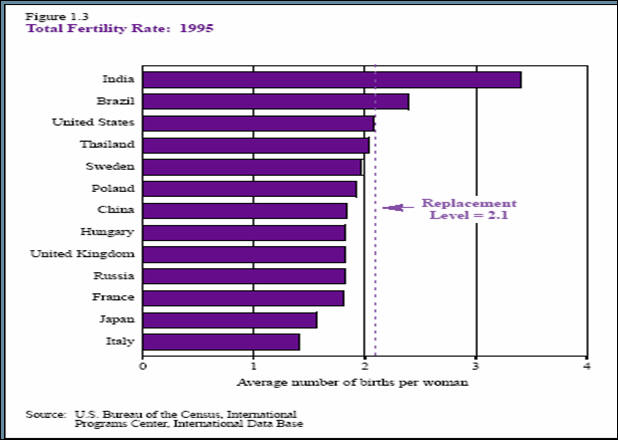
This chart is based upon 1995 data and shows that many countries are not replacing their populations. Since 1995, the growth of population in many areas has been affected by not only famine but also the AIDS epidemic. However, within the last decade, the countries that continue to increase in population are those most affected by poverty. The developed countries by their lack of reproduction have laid the groundwork for their demise and ultimate influence.
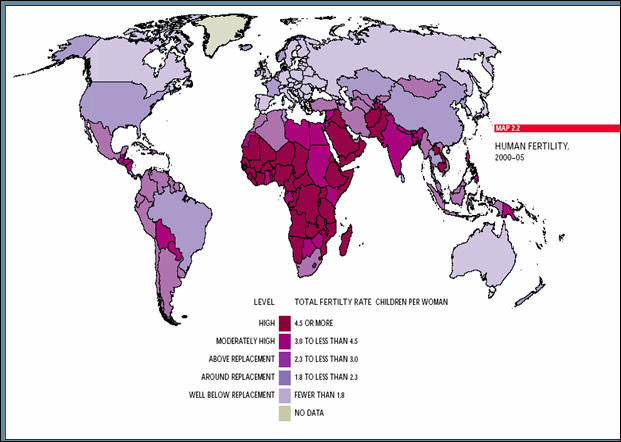
A look at next chart will show quite dramatically that despite the AIDS epidemic, population growth occurs primarily in un-developed countries.
|
|||||||||||||||||||||||
AIDS could upset the Forecast. |
|||||||||||||||||||||||
| Since the AIDS virus was first identified, there has been
a continual drumbeat as to the terrible consequences that it could bring to
the planet. In several forums, the AIDS epidemic has been compared to
the disasters that befell the world's population during the bubonic plague.
Whether a cure will be found for AIDS is still an question. However, the lives
of those infected by the AIDS virus can be improved through expensive drugs.
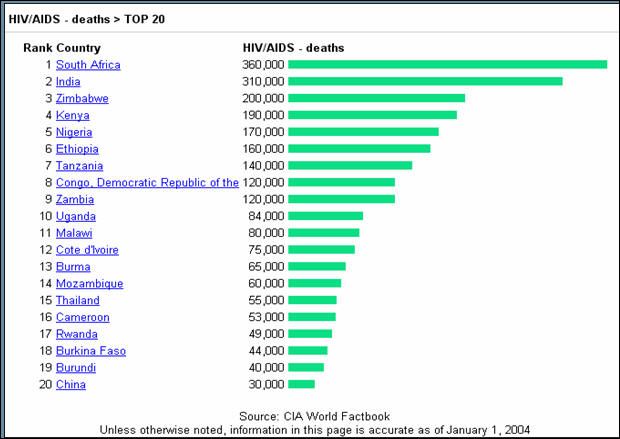
This chart shows the number of deaths in total from AIDS. Note that the U.S. is not on the top 20 list. Since many of the deaths have occurred in areas where vital statistics are difficult to obtain, there is some concern about the figures cited in this report. Yet, the National Institutes of Health spends more money on AIDS research than any other country. In fact, more people die in auto accidents every year than the total number of U.S. AIDS deaths to date. While contaminated drug needles and blood transfusions have been methods of infection, the primary source of the AIDS virus has been sexual or oral contact. However, there appears to be indications that the virus can be contacted by breathing air in the extremely close proximity of an AIDS carrier. The bulk of deaths from the AIDS virus have occurred in Africa. However, during the past two years, the AIDS virus has made significant inroads in India, China, Malaysia and Russia. In the U.S. treatment has reduced the death rate. However, in 2003 and 2004, the number of cases has increased slightly. The real problem remains the under-developed regions as well as India, China and Russia. In those areas, we are seeing large increases in HIV infection rates and as a result, the GDP forecasts for those regions could be in jeopardy if no cure is available. Treatment costs are extremely high in relative terms for these areas. India produces low-cost generic AIDS treatment drugs but cost and availability prohibits many from obtaining access. In fact, most of India’s production of HIV drugs is sent to Africa under the U.N. program. While there is no cure in sight, there has been an important development within the past three months on an anti-viral drug that appears to act to stop the disease from spreading within cells. If the AIDS problem is not solved, the GDP numbers forecasted by ExxonMobil can not be achieved.
|
|||||||||||||||||||||||
Major Concerns |
|||||||||||||||||||||||
TerrorTerrorism continues to impact countries. This chart was prepared in 2002 and showed the location of many Islamic groups that were considered to be terrorist fronts or worse.
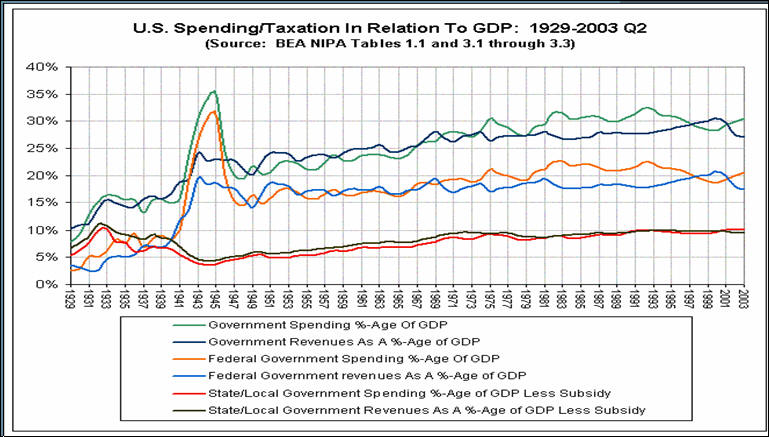
However, when one looks at the number of deaths in the U.S. from terrorist acts, it is still an extremely small number compared to other causes over the last decade. Our politicians have spent billions foolishly trying to make the citizens feel better while in actuality they will never be able to stop a determined terrorist willing to give up their lives. And that is the definition of a suicide bomber. When the politically correct mindset causes us to randomly select rather than profile travelers, the game is lost. There will never be such a thing as perfect security and what we currently have is basically useless. Energy ConsiderationsOur failure to develop our own sources of energy or to allow regulations which are scientific but fail from an engineering standpoint is unpardonable. When in 1956, it was decided to improve air quality, the scientists overcame the engineers objections and wrote the standards in parts per million (ppm) per gallon of gasoline consumed rather than in ppm per miles traveled. As a result, the average fleet mpg dropped in 1956 from 18 mpg to 9 in just 10 years. Yet, in 1956 the Nash and Hudson automobiles were averaging 28 mpg. EducationSince the 1950’s, the NEA and their politicians have implemented programs that have brought us teacher certification and increased spending on education. In 1962, the Department of Education budget was $816 Million. In 2004, the federal budget was $62,815 Billion. Yet despite the huge increase, today’s students have lower SAT scores. In every subject, our secondary students are ranked lower in all subjects against the world’s school systems than they were in 1950. Teachers are required to spend almost as much time preparing lesson plans as teaching. We are now in our third generation of teachers who have graduated and become certified from schools who primarily prepare teachers. Unfortunately, the vast majority of these teachers come from the bottom 25% of the SAT pool. In Texas, students rank 47th nationally in high school math proficiency. Is it any wonder that our students are behind? The end results are devastating to a country that hopes to retain technological supremacy. Fewer than 15 percent of U.S. students have the prerequisites to pursue scientific/technical degrees in college according to the Council on Competitiveness in a December 2004 report. It should be obvious to taxpayers that the NEA's political solution of just throwing more money at the problem has failed. While the culture has changed and parental involvement has dropped, the judicial solution which bused students between schools also created consequences that began the methodical destruction of the public school systems effectiveness. The growth of private schools as well as home-schooling is proof of the failure of public education. Lack of a Manufacturing BaseAs the free-trade crowd gained momentum and our wage and benefit structure soared beyond other countries, whole industries and their workers began to move to other countries. Manufacturing has fallen from 38% of GDP in the 50's to about 20% today. A falling dollar will not help our exports grow if the manufacturing plants are not here. As we have changed from a manufacturing to a service-based society, there is one major aspect that many politicians and management fail to appreciate. The people who own the company generally want their employees to use the same language and understand their culture. When an U.S. company becomes owned by a French, German, Swedish, Japanese and/or Chinese group, you better expect major changes within a few short years. In some cases, the U.S. subsidiary is shut down and all the technology and patents and on-going research is sent back to the owners country leaving the U.S. employees to find their way to the unemployment lines. Look at the telecommunication corridor for verification of this fact. There are many others. But more important is the lack of skills and manufacturing capability to provide for our own defense. During World War II, the U.S. was able to provide the necessary equipment to arm the free world. Today, we have to ask off-shore suppliers to provide a lot of that material. Moreover, the tool and die makers and the engineering talent have retired and not been replaced. The Secular SocietyAlthough the country is predominately Christian and/or Jewish, s major trend has developed within the judiciary and the ACLU (founded by an avowed Communist) to move towards a secular-based society. It is no longer permissible to have the Ten Commandments in many courthouses, nor Christmas displays in schools or government buildings. Some federal buildings have even gone so far as to remove Christmas trees so as not to offend someone. Well, believe me when I say, I am offended and I believe that the majority of this country’s taxpayers are. Growth of Government at all levelsThe growth of federal spending has been upwards for many years.
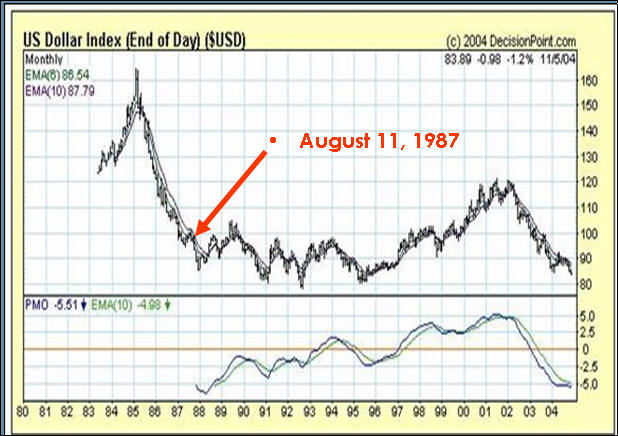
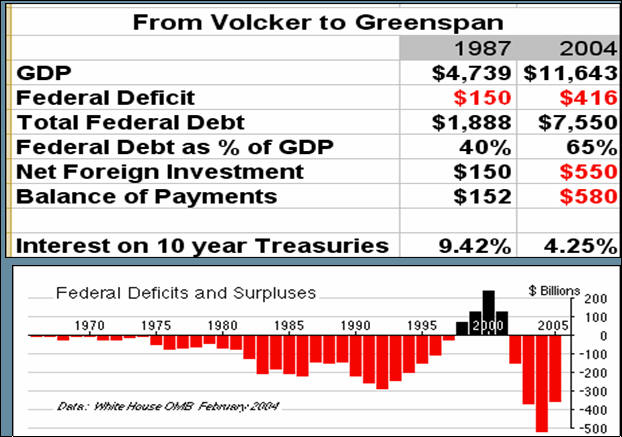
During the past decade we have seen the government sector become the largest employer in the U.S. Today, the government (federal, state and local) accounts for approximately 30% of GDP, which is an increase from the 20% level of the 1950's. The CATO Institute and others have projected that by 2010, government at all levels could account for 35% of GDP. From Volcker to GreenspanIn the late 1970's and early 1980, inflation was rampant and short-term interest rates were above 20%. After Paul Volcker became Fed Chairman in 1979, the brakes were really applied to the economy. In a few short years, the Reagan administration was able to reduce interest rates to the 6% range. Greenspan became Fed Chairman on August 11, 1987. The following chart shows the movement of the U.S. dollar index during his stewardship.
If one just looks at this chart, the performance is not terrible. However, we also need to look at other aspects of the economy during Greenspan's term as shown below.
The surpluses shown in the chart are purely accounting fiction as the federal debt went up each year of the Clinton administration.
|
|||||||||||||||||||||||
Looking at the America's |
|||||||||||||||||||||||
CanadaCanada is our largest trading partner in the hemisphere. However, relations with Canada will continue to be strained as long as the Quebec region dominates their government. It is the French genes, you see. Most Canadians do not like our newly-imposed restrictions on travel between the two countries. We also have trade issues on beef, wheat and lumber which have many Canadians unhappy. Many western Canadians find it galling that the dismantling of their military forces means that they are now totally at the mercy of the U.S. for their own defense capabilities. ImmigrationImmigration and the delivery of taxpayer funded benefits to illegal immigrants is becoming an issue among U.S. citizens. We have adequate laws on the books but do not enforce them. Today’s technology could be used to identify every illegal alien discovered. Rather than putting them in jail, we should provide them with a one-way airfare back to the nearest airport to their home with the stern warning that the next time they arrive without papers, they will be summarily executed. Unless we get serious about illegal immigration, we will find the Southwest becoming a part of Mexico in the next 10 to 20 years. Russian InfluenceRussia continues to assist Cuba and Venezuela in their attempt to destabilize the Latin and South American countries. Cuba has been a Russian ally since Castro took power. Venezuela continues to gain economic and other aid from Russia since President Hugo Chavez took power. Chavez will be making his third Presidential visit to China this month. He has also visited Russia in trips to obtain economic aid. Both these countries will remain problems for the U.S. Illegal drugsThe drug trade will continue to increase because of American demand. The War on Drugs is basically a failure and consumes billions of dollars each year without concrete results. Prohibition of alcohol did not work and only the legalization of drugs to allow U.S. farmers to grow the product as another cash crop and to have the proceeds taxed will provide the framework to reduce the problem. In the meantime, we spend way too much time and money keeping small-time drug users and pushers in jail while those making the real money don’t pay taxes and rarely serve time. AgricultureDuring the past decade, we have seen major increases in the number of acres cleared for agricultural operations in both Brazil and Argentina. Many agricultural graduates of Iowa State and Purdue have moved to these countries to farm since 1990. For the same amount of capital to farm 640 acres in Iowa or Illinois, they are able to farm 10-15 times the acreage in South America. The big restriction to more competition from South American used to be the lack of infra-structure to move agricultural products to market. But thanks to our Import/Export Bank, the U.S. taxpayer has made these South American farmers more competitive. The Panama Canal ProblemPresident Carter was responsible for allowing the Chinese to take-over the operation of the Panama Canal. Today, it will require an act of military force to reopen the canal if the Chinese decide to close the Canal to our Naval and Commercial Vessels. China Investment in South AmericaThe Chinese have also been investing in copper and other mining industries throughout South America both directly and through investment vehicles with headquarters in both the Far East and Europe. The Chinese realize that control of commodity wealth in the 21 century will be vital to their growth.
|
|||||||||||||||||||||||
International Outlook - Middle East |
|||||||||||||||||||||||
Iraq & SyriaPresident Bush is adamant that Iraq hold elections in January. Efforts to thwart elections will probably intensify in the next few weeks but our forces in theatre continue to climb towards 150,000 or higher. Much of the force increase in recent weeks has come from South Korea. There are clear indications that Iraq with Russian assistance transferred the WMD through Syria to the Bekka Valley in Lebanon. With Arafat gone, the PLO is in the midst of a power struggle. The Bathist party in Syria has assisted the Iraq terrorist organizations by providing access to Saddam Hussein's bank accounts as well as providing safe passage for terrorists to infiltrate into Iraq. TurkeyTurkey is also becoming a problem for the U.S. Not only did they not allow us to move troops through Turkey before the last Iraq invasion but they are now massing forces to move into Northern Iraq following elections to prevent the Kurds to have control of the northern oilfields. It is entirely possible that with Russia courting the Turks, things could erupt in this sector. Iran & Saudi ArabiaIrrespective of the outcome of Iraq’s elections, turmoil in the Middle East will continue during 2005. While Iran may become a flash-point, the more critical area is whether the House of Saud will fall. The production decline of the major Saudi oil reservoirs is now becoming critical as water injection secondary recovery techniques have created recovery problems.
Iran and China have tentatively agreed to build a $3.5 Billion LNG pipeline from Iran to China as shown above. The deal is expected to bring at least $100 Billion of LNG from Iran to China and perhaps $200 during the next 25 years. Currently, Iran has 10 LNG tankers and needs at least another 87 just to handle the volume currently on the books without the China deal. There is a rumor that the Iran/China LNG pipeline comes with a Mutual Non-Aggression pact that could prove difficult if the Iranian students rise up and topple the mullahs. Situated on the western shore of the Persian Gulf, Iran recently announced another pipeline to carry oil and gas to India. Since a large portion of the pipeline must cross Pakistan, relations between India and Pakistan have improved slightly. The Iran/India pipeline deal could provide the impetus for Pakistan and India to resolve the Kashmir dispute. Less reliance on the U.S. dollar as a reserve currency.The Malaysian dinar is going to replace the U.S. dollar as the trading currency between many Islamic nations. We have already seen transactions that involve tanker cargo's being priced in dinar rather than U.S. currency. As the dollar falls, expect to see more trading transactions primarily in oil priced in currencies other than the greenback.
|
|||||||||||||||||||||||
International Outlook - European Common Market (ECM) |
|||||||||||||||||||||||
|
Many factors including the cost of government will hamper the growth of GDP in the Euro nations. For years, their socialist governments have enacted laws and regulations that have basically destroyed the work incentive. As a result, as their populations have aged, guest worker programs as well as their immigration policies have created a situation where the basic Western civilization values and ethics are in danger of being undermined. As secularism has advanced in the ECM, the role of the Catholic Church has been diminished. Expediency has become the mantra for politicians and corruption is riding high. Much of the blame for the success of the Iraq Oil-for-Food scandal can be laid at the feet of the ECM and Russian business and political leaders who were enablers as well as recipients of the largesse. Muslims have become almost 40% of the French population and Germany and Holland are also under siege. The result is an economic malaise in the European Common Market. The growth rate for the ECM countries will probably be in the 2% range in 2005. While they may see the Euro appreciate against the U.S. dollar, the old culture differences and tribal warfare that has existed in Europe for eons will probably see the ECM collapse before 2020.
|
|||||||||||||||||||||||
International Outlook - Far East |
|||||||||||||||||||||||
ChinaDuring the past few years, the development of the China economy has been spectacular. In 2003, GDP grew at a 15% level and even with the brakes applied, the current growth rate is in the 10% range. In 2004, China is expected to have a GDP of $1.5 trillion, about 10% of the U.S. However, that growth has come with a price. In many commodities, China is not currently self-sufficient and has to import its requirements. China has recently announced the LNG deal with Iran and another oil pipeline to Russia. These trade agreements reduce China's need to secure its energy requirements in the open market. Also, in the case of Russia, they help reduce the border tension between the two countries. China's trade surplus with the U.S. has been growing. It now represents the second largest holder of U.S. dollar reserves in the world. However, its banking system is in deep trouble. Some estimates place the country's bad debts at $438 billion or about 28% of annual GDP. Clearly, the debt restructuring task facing China is huge. However, China is caught between the proverbial rock and a hard place. The China drive to industrialization and the need to maintain the Communist political structure have built many pressure points of confrontation. As the country has industrialized, many peasants have moved towards the industrial areas. Likewise, the Three Gorges Dam, the largest construction project in history, cost $75 Billion to complete and displaced millions of people who had to be relocated. The number of new jobs that have to be created in China each year is greater than the number of jobs that are needed in both the U.S. and the ECM combined. This fact alone creates a major problem for the Chinese politicians. The big risk is that as the privatization movement has grown during the past decade, the political risk for the regime has also multiplied. If the economy turns down and encounters a hard-landing, could a political revolution unseat the party? Although China received WTO status recently, the currency peg to the U.S. dollar will not float freely until it is no longer in China's best interest. If China were to revalue by 40% or better, which is what many believe is a more realistic relationship, the cost of Chinese goods would shrink their exports by a significant margin and cause wide-spread unemployment as well as a financial melt-down. China will continue to increase its purchase of hard-assets throughout the world and to reduce its holdings of U.S. paper as it continues to fall in value. TaiwanThe recent election in Taiwan with the independent faction losing eases the military risk over Taiwan. For years, Taiwan companies and management skills have been acquired by mainland Chinese companies. At some point, the matter of independence will no longer be at issue and Taiwan will become a part of mainland China similar to Hong Kong's status. JapanJapan's economy is still in the doldrums almost 15 years after the collapse of the real-estate bubble. Japan's banks are still working through the bad loans from the 1980's. Growth in 2005 is expected to be in the 2.5% area. The yen will continue to appreciate against the dollar. The savings rate of Japan far exceeds that of the U.S. and provides the underpinning for its recovery. Recent incursions by the Chinese into Japanese territorial waters as well as the North Korean problem have enabled the government to move towards increasing the security forces and defense capability of Japan. South KoreaSouth Korea is discovering that the withdrawal of U.S. Forces to Iraq leaves them uncomfortable. Relations with North Korea are not improving. However, South Korea has recently made trade deals with China which have helped offset some of the political tensions between North and South Korea. Its economy is expected to grow about 3.5% - 4% in 2005. However, the withdrawal of U.S. troops could reduce that estimate. North KoreaNorth Korea is an economy on the brink of starvation. North Korea, one of the world's most centrally planned and isolated economies, faces desperate economic conditions. North Korea has a population of about 23 million and a GDP of approximately $29.6 Billion according to the CIA in 2004. The GDP growth rate was about 1% in 2004. Industrial capital stock is nearly beyond repair as a result of years of underinvestment and spare parts shortages. Industrial and power output have declined in parallel. The nation has suffered its tenth year of food shortages because of a lack of arable land, collective farming, weather-related problems, and chronic shortages of fertilizer and fuel. Massive international food aid deliveries have allowed the regime to escape mass starvation since 1995-96, but the population remains the victim of prolonged malnutrition and deteriorating living conditions. For years, the population has existed on hand-outs from humanitarian agencies while the regime has invested its meager assets into military hardware. China has been attempting to stop mass illegal migration of North Koreans escaping famine, economic privation, and oppression into northern China but to little avail. In 2003-4, heightened political tensions with key donor countries and general donor fatigue threatened the flow of desperately needed food aid and fuel aid as well. The other countries in the Far EastThe rest of the Far East is also dependent upon exports to China and the U.S.
|
|||||||||||||||||||||||
The China Blueprint |
|||||||||||||||||||||||
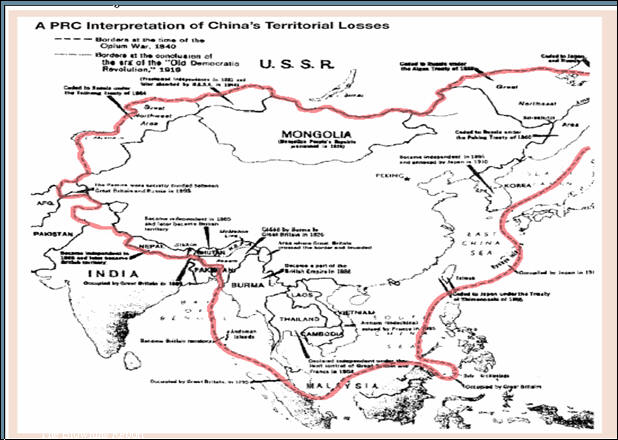
| Until recently, the map shown below was used in most of the
history and geography books in China. The current leadership of the
Communist party grew up believing that the Chinese Empire encompassed the
area outlined here.
It should never be overlooked that the Chinese leaders view the area inside the red lines as their area. There are many overseas Chinese who still look to China as their primary allegiance. The same could also be said for the Japanese.
|
|||||||||||||||||||||||
Russia tries to flex its muscle . . . |
|||||||||||||||||||||||
|
We are definitely seeing increasing movement by Putin and the Russian government to move towards increasing their influence around the world. Whether this advocacy will begin to harden attitudes between Russia and the U.S. and the resumption of the Cold War era is not clear. We are also seeing relationships building between China and Russia as China purchases arms and oil from Russia. For years, weapons have found their way onto the black market from the Russian military as officers and other personnel were not paid. Putin is using raw political power through the implementation of tax edicts to remove opposition leaders. Yukos, the oil giant, and Vimpel, the communications company, were only the most visible of Putin’s use of tax edicts to take over or destroy possible political rivals.
|
|||||||||||||||||||||||
The U.S. Achilles Heel - Vendor Financing |
|||||||||||||||||||||||
|
The U.S. is now beginning to see the consequences of becoming dependent upon foreign nations to provide vendor financing for its growth. The twin deficits of trade and government have risen to a point where many foreign holders of U.S. paper are wondering what the meaning is of “full faith and credit of the U.S.” Many refer to the Far East recycling of U.S. trade surpluses into U.S. Treasury instruments as “vendor financing.” Some analysts have said that only by continuing to support our consumption can the Far East prevent a recession in their countries. Well, let us all remember, that vendor financing works until the value ceases. When the dollar drops to that uncertain point, the vendor is left with nothing but paper which has little or no value. Many now bankrupt telecom and internet suppliers tried vendor financing to boost sales.
|
|||||||||||||||||||||||
Foreign Capital Inflows to the U.S. |
|||||||||||||||||||||||
The U.S. currently requires over 75% of the world’s free cash
flow to continue to finance its twin deficits. How much longer can this continue?
In just the last four years, the ability of U.S. concerns to invest off-shore has eroded dramatically. In 2000, 22.6% of world-wide foreign domestic investment was from the U.S. By 2003, the U.S. share had dropped to 5.3%. FDI from the world had increased to $53 Billion into China in 2003 surpassing the U.S. In 2004, FDI from the world into China is estimated at $75 Billion.
|
|||||||||||||||||||||||
The Strong Dollar under Secretary Snow |
|||||||||||||||||||||||
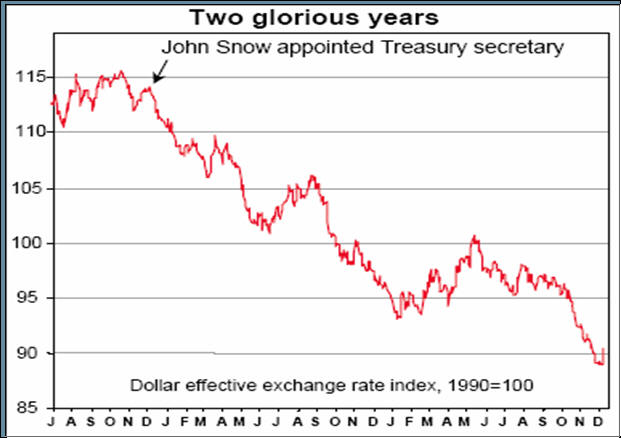
| John Snow became Secretary of the Treasury in January 2003.
He has consistently spoken about being a champion of a “strong dollar policy.”
However, the policies which he inherited and is now responsible for along
with Alan Greenspan’s efforts at the Federal Reserve Bank have not been exactly
conducive to maintaining a strong dollar. This chart shows the decline of
the dollar since Snow entered office versus the British pound. I leave the
reader to determine if Snow was effective.
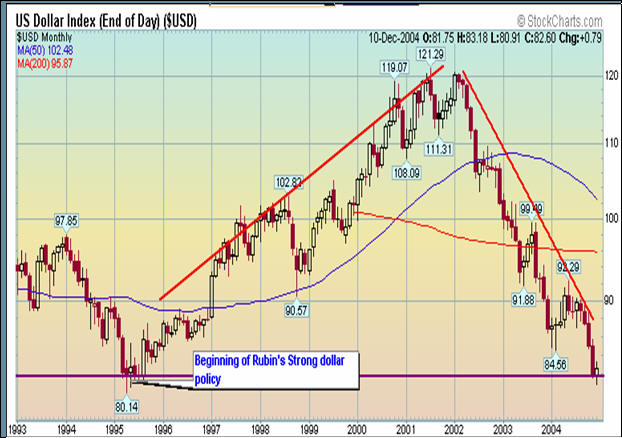
One of Bush's first mistakes in his second term was to reappoint John Snow as Treasury Secretary. Snow's lack of credibility in world financial circles is astonishing. However, the dollar has been in decline for some time. With the exception of wartime periods, between 1783 and 1913, inflation was zero. Essentially we had no inflation. But as soon as the Federal Reserve system came along, here comes inflation. If you go here, you can compare today's dollars with those of yesteryear. Using the government's own figures, we can soon see that to equal the purchasing power of $100 in 1913, we would need $1840 today. All the product of the Federal Reserve system. The cause is simple. In a fractional reserve system, even a gold fractional reserve system, all money is created by loaning money into existence. And the more loans you make, the more profit you can make. It is a perpetual motion machine. Just as long as you keep expanding the money supply (inflation) everything works. Or until people borrow far more money than they can afford to pay back. At that point the system implodes and deflation sets in as the money supply collapses. Many forget that in 1970 the U.S. dollar index was at 150. It then began a long slide until Robert Rubin implemented a strong dollar policy in mid 1995. As a result of the economic boom in the late 90’s as well as use of the Exchange Stabilization Fund, the dollar index rallied from about 80 to 122 in seven years. It took less than three years to fall back to the 80 level as shown in this chart.
Until the U.S. addresses its twin deficits, the dollar will remain in its downward trend with brief rallies occurring. One of the glaring errors being made by the Treasury is the elimination of the 30 year bond. Prior to the start of the Fed's interest rates hikes, the U.S. Treasury should have sold as many 30 years bonds at the historic low interest rates as possible. Now, with interest rates at a higher level, it will be more costly issue long bonds. However, the fact remains that interest rates will go higher and these low interest rates should be locked in on long-term bonds.
|
|||||||||||||||||||||||
World Reserve Holdings |
|||||||||||||||||||||||
|
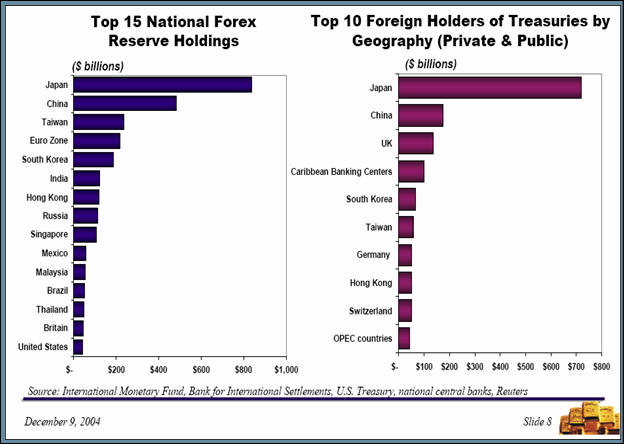
As of December 9th of this year, the Forex and Treasury holdings of various countries are depicted in this chart. Note that while Japan is by far the largest holder, China has been gaining in recent years. When Taiwan’s holdings of currency reserves are added as well as Hong Kong’s to China’s, the group is nearly equal to Japan.
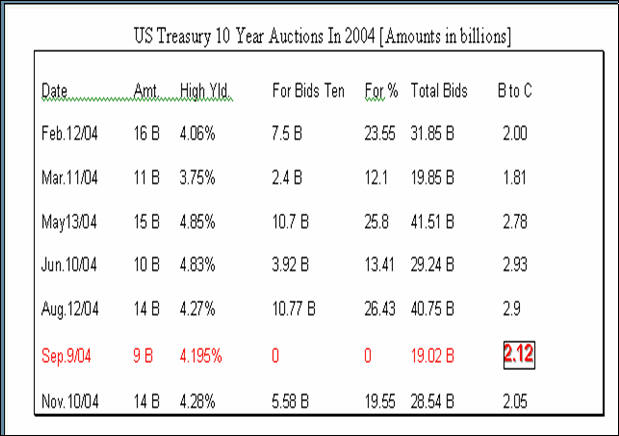
With the demise of the 30 year note, the 10 year Treasury has become the measuring stick. The next chart tracks the results of the 10 year auctions in 2004 through November.
The King Report had this to say about the December 2004 auction:
Foreign investors should no longer be automatically counted upon as purchasers of U.S. Treasury offerings until either interest rates go up substantially or the twin deficits are reduced.
|
|||||||||||||||||||||||
Outlook 2005 - U.S. |
|||||||||||||||||||||||
We will now try to put the puzzle together and once again
step into the lion's den of forecasting the future. These predictions may
make about as much sense next year as taking salt into the Coliseum games
in Old Rome to protect oneself from the animals.
|
|||||||||||||||||||||||
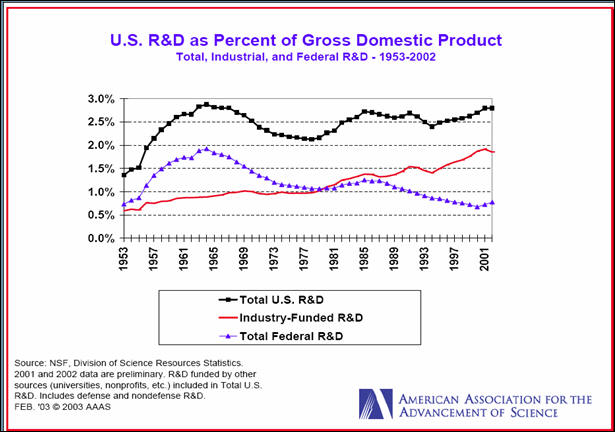
R&D is the Key to Technology Supremacy |
|||||||||||||||||||||||
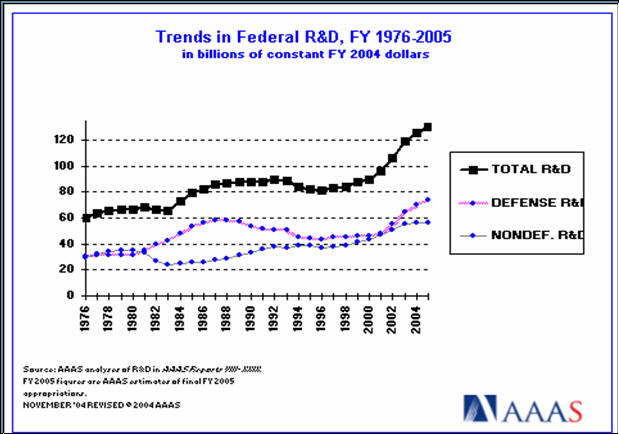
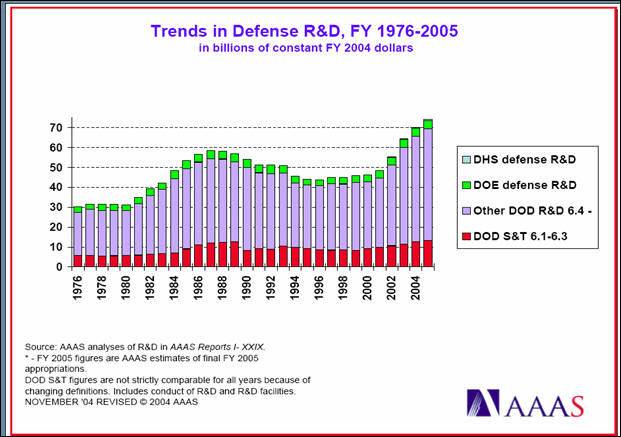
Federal Sponsored R&D FundingThe U.S. believes that it can remain the world's super-power through its technological dominance, primarily, in military hardware. Let us briefly examine that premise. Total R&D spending under George W. Bush has increased dramatically. During the Clinton administration, R&D spending both in absolute as well and percentage of GDP fell with the primary cutbacks in defense research.
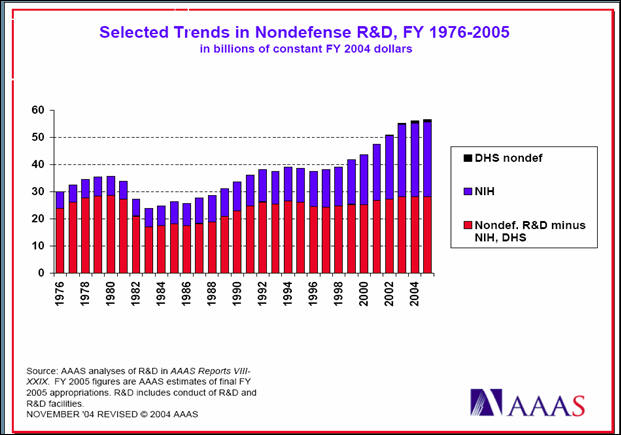
However, in the last two decades, the growth in non-defense federal R&D has been outstripped defense spending. The National Health Institute has been the primary recipient of the growth in R&D spending as shown below.
The shrinkage in defense R&D is clearly shown in the following charts during the Clinton Administration. Since 2000, when George W. Bush took office, defense spending on R&D has clearly increased.
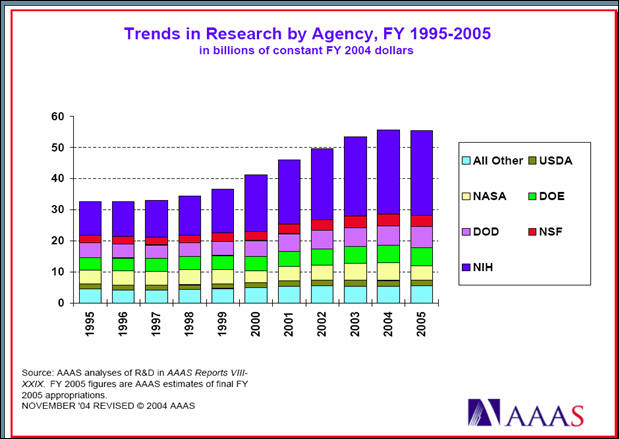
The next chart clearly sets out the funding by governmental agency during the 1995-2005 period. Again the big spender remains the National Institute of Health despite the ramp up in defense spending.
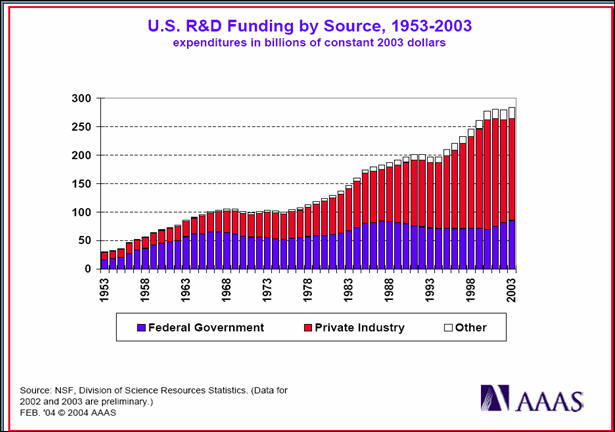
Private and Industry FundingAlthough government funding is highly visible and important to many researchers at academic institutions, the industry sector has become the more important source of R&D funds in recent years as shown below.
However, when viewed as a percent of GDP, R&D funding which has been the basis for our technological supremacy has remained between 2.5 and 3% of GDP.
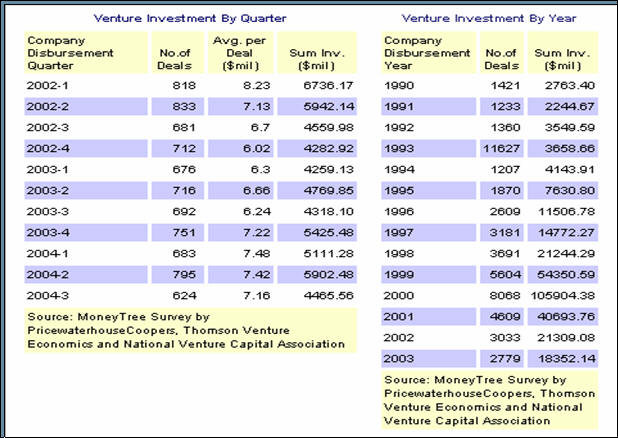
If we are to remain on top, R&D funding needs to increase to the 4% of GDP range. Venture Capital FundingWhile R&D funding is important, it generally requires venture capital to bring the product to market. During the mid and late 90’s, vast sums were thrown foolishly into the venture capital arena. Since the 2000 crash, venture capital has fallen greatly. Higher venture capital investment will be required to maintain our superiority in technology. However, we also can not just give it away to other nations like the Clinton administration allowed. The trend in Venture Capital Funding in recent years is shown in the following table.
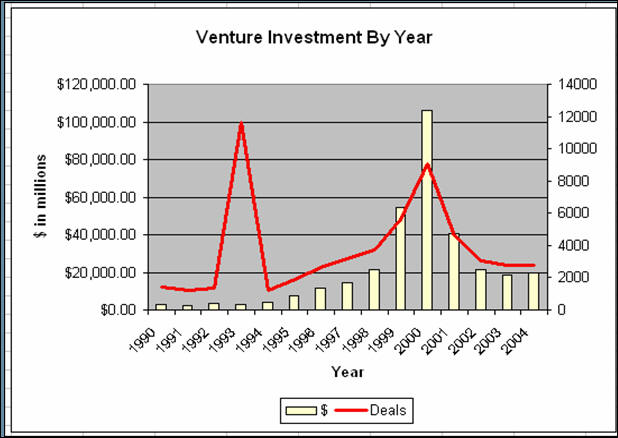
A more vivid understanding of the ebb and flow of venture capital can be seen in the following chart. The data for 2004 uses estimated data for the 4th Quarter.
While the excess of the late 90's saw billions of ill-advised investments, venture capital funding needs to become less worried about great wins and more about helping new technology flourish.
|
|||||||||||||||||||||||
Technologies to Watch |
|||||||||||||||||||||||
|
The four promising technologies to watch are nano, biomass, nuclear, and hybrid vehicles. Significant commercialization of nanotech is probably 5 to 10 years away. Biomass on the other hand could be very interesting in the near future. Ethanol production is rising and new plants are lowering the costs of production. Biomass plants are now operating on turkey and hog waste. One test plant is now operating using raw sewage prior to treatment to make gasoline. As the technology improves, expect costs to come down. If it was not a political or NIMBY problem, the nuclear industry should be providing most of the world’s electricity.The Department of Energy has a project small, sealed, transportable, autonomous reactor (SSTAR) to build a portable nuclear plant which could provide electricity for either 100 megawatts or 10 megawatts. The plant would operate for 25 years before it would need to be replaced. A 100 megawatt facility could provide the power for a city of about 100,000. Although alternative fuels can decrease our reliance upon hydrocarbons for gasoline, the development of hybrid vehicles also provides a significant opportunity to reduce gasoline demand per mile traveled. At the moment, the replacement battery costs are very expensive. Nevertheless, hybrid vehicles could grow to 25% of the market this decade.
|
|||||||||||||||||||||||
Industries with Problems |
|||||||||||||||||||||||
TransportationBecause of the rising cost of fuel and environmental regulations, the transportation industry is facing trouble. In the airline business, the cost of labor has pushed many of the airlines along with fuel costs into and/or near bankruptcy. Trucking and shipping are subject to increased operating and regulatory costs. AgricultureAgriculture also is facing critical issues with water rights and ground pollution costs. Good agricultural land is being lost to urban and suburban development. In many states, state environmental regulations are more harsh than the EPA’s. The rising cost of land and operating expenses has seen the profitability of farming come under serious pressure. During the past five years, the average age of farm operators has increased by 4.75 years. Today, in many growing areas, land has been priced out of agriculture. As a result, many crops formerly grown in the U.S. now have to be imported. Also, the San Joaquin valley in California is also losing acres from the increasing salt levels. The level of the West Texas aquifer remains at critical levels thereby preventing thousands of acres in West Texas from being irrigated. In Idaho, environmentalists are demanding that all irrigation canals and dams on the Snake River be removed. Waste Generating Processes & Natural Resource IndustriesBecause of environmental concerns, waste generating processes including metal plating plants, mining processes, etc., have been subjected to massive cost increases. Many industries have moved from the U.S. to foreign countries where the regulatory situation is not as complicated or expensive. Cement plants, steel plants, and oil refineries are just some of the smoke-stack industries that find themselves in serious trouble. Natural resource companies including ranching and timber as well as oil and gas extraction companies find themselves constantly in the cross-hairs of the environmental groups. Health CareHealth care is another area of concern. Not only is the share of GDP growing but the level of care is decreasing. Several countries have higher standards of care than the U.S. The American Academy of Anti-Aging Medicine (A4M), a medical society dedicated to the science of longevity medicine, reported that 90 percent of all healthcare dollars are spent on extraordinary care in the last two to three years of life. Likewise, a total of 50 percent of the U.S. healthcare budget is spent on degenerative diseases of aging (Health Care & Finance Administration, 1996). The US percentage of GDP spent on healthcare has increased from 5% in 1950 to 15% in 2003. Clearly, the cost/benefit ratio to society is going to have to be debated as the percentage grows in the future.
|
|||||||||||||||||||||||
Investment Strategies to Consider in 2005 |
|||||||||||||||||||||||
|
During 2005, we believe that investors should be extremely careful about their investments. The possibility of a financial disaster has risen as competitive devaluations escalate throughout the world. Hence, we believe that the following are points to consider.
|
|||||||||||||||||||||||
Investment Opportunities to Avoid |
|||||||||||||||||||||||
Real EstateAdjustable rate mortgages are about 80% of all outstanding mortgages. As interest rates move higher and if the economy does not improve greatly, the current delinquency and foreclosure rates will look tame by the end of the year. As a result, real estate prices except in selected areas will begin to come down causing further distress among home-owners that have over-extended themselves. Derivative plays without transparencyThe COMEX and NYMEX markets are derivative plays without full transparency. Interest rate swaps have the potential for losses if a third-party is unable to perform. The exchanges have been known to change margin rates and other rules to prevent the exchanges from taking severe losses. Bunker Hunt and his family discovered that fact many years ago. The metals markets and particularly, the precious metals sector, are managed markets and as such operate without transparency. Financial StocksWith interest rates rising, the historic spreads between borrowing and lending can only be squeezed. As a result, profitability of financial stocks should be under pressure in coming months. GSE’s and Housing-related stocksThe SEC has confirmed that Fannie Mae has violated its accounting rules and that the GSE would have to restate its earnings from 2001 through mid 2004. The company's accounting "did not comply in material respects" with accounting rules for derivatives, financial instruments used to hedge against interest-rate swings, and for some transactions related to loans. Fannie Mae will record an estimated $9 billion loss in the 3rd quarter of 2004. That represents about 40% of the companies equity. As they finance one of every five homes in the U.S., loan financing could become a problem in future months. The fall-out could also embrace both Freddie Mac and Farmer Mac and make the Savings and Loan bail-out look minor. Besides the accounting problems cited in the SEC report, the low-income loan portfolio has a delinquency rate that is at all-time highs. The real question for investors in these stocks is how good are the underlying loans? BondsUnless you are willing to hold to maturity and don't concern yourself with receiving back inflated dollars, continue to hold bonds. Otherwise, don't.
|
|||||||||||||||||||||||
Investment Rules to Remember |
|||||||||||||||||||||||
Over the years, these four rules have proven important.
Remember that the middle 80% of a move isn't bad. |
|||||||||||||||||||||||
Don't forget that wealth is measured differently than currency. |
|||||||||||||||||||||||
| If you only consider your wealth as measured in U.S. currency,
you have failed as a successful investor. The dollar has lost about 33% of
its value during the past two years when measured against other currencies. If your portfolio in U.S. dollars was up 10% each year, are you really ahead of the game? To be a successful, long-term investor, you have to understand both the problem of inflation as well as currency fluctuations. The failure to understand this problem has reduced many fortunes to only a shadow of their original size. |
|||||||||||||||||||||||
But then - 'Tis Only My Opinion! |
|
| Fred Richards December 2004 Corruptisima republica plurimae leges. [The more corrupt a republic, the more laws.] -- Tacitus, Annals III 27
This issue of 'Tis Only My Opinion was copyrighted
by Adrich Corporation in 2004.
Last updated - July 6, 2008
|
|