The events of the past six weeks in the market and in the U.S. have caused many to wonder if we are beginning one of those sea-change events that can completely change the outlook for the markets and our country.
Since NASDAQ peaked in early March at over 5,000, it fell to the 3,300 level and many were wondering whether a bear market was underway. On the political front, many were upset with the seizure of Elian Gonzalez by force in the middle of the night just before Easter. To others, the NATO problem in Yugoslavia, e.g., the Serbian conflict, seemed ominous. Putin was elected President of Mother Russia and immediately began taking a hard line towards NATO and the US. On Friday, it was announced by a significant part of the Russian Northern Fleet was being transferred to the Mediterranean Sea. Clearly, the status quo was in question.
Inflation in the US seemed to be gaining a foothold (of course, who believes the government numbers anyway). You just had to go to the store, the gas station, or try to hire an unskilled worker to know that wage and price inflation had been around for several months.
The most important course for me at HBS was Dr. Ralph Hidy's, Business History. And his treatment of speculative bubbles and the pendulum effect of business cycles have been of immense value to me over the years. It seems that now is a good time to step back and review some of those principles of history that Dr. Hidy tried to get his students to understand.
First, all governments are eventually corrupt and are inhabited by thieves.
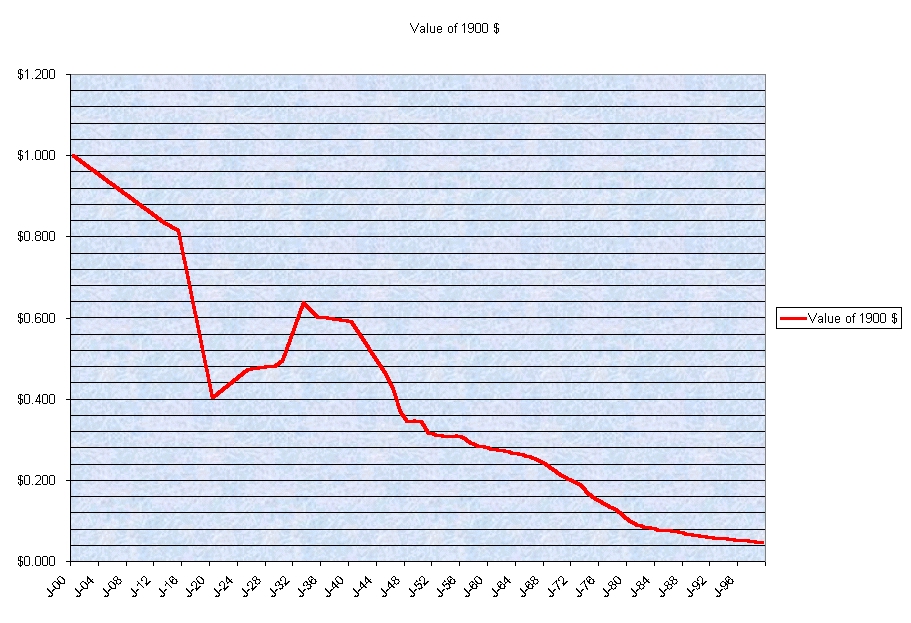
Since the beginning of time, governments have found a way to steal from their citizens by excessive taxation, inflation, demonetizing money, and pure confiscation of wealth. In 1900, the federal debt of the U.S. stood at less than $1 billion and our currency could be redeemed for either gold or silver. Try getting gold or silver for your Federal Reserve Notes today.
In 1900, the U.S. Treasury and others issued currency. In 1914, the Federal Reserve was created and began issuing notes. The following chart illustrates the decrease in value of the American Dollar since 1900.
Today's dollar is not worth a plugged nickel in value as compared to the 1900 Silver Dollar. It is only a medium of exchange and is not backed by anything of tangible value other than confidence. In other words, today's dollar is only worth what someone says it "is" and where have we heard that expression recently.
The stated federal debt is now about $5.7 trillion and if the government had to account for all of its liabilities like it requires corporations, the real number is probably in excess of $24 trillion. Shown below is a graph showing the growth in the federal debt since 1900.
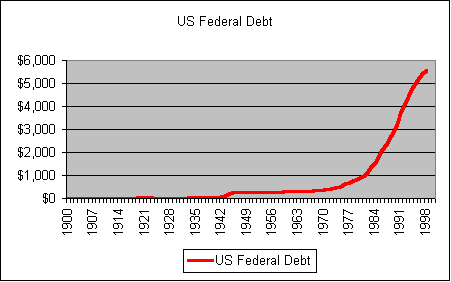
A few historic observations. After WWI, the federal debt peaked at $24 billion and declined to a low of $16 billion in 1929. After 10 years of depression in the 1930's, it only stood at $43 billion at the end of 1940. The debt increased significantly during WWII and stood at $258.6 billion at the end of 1945. During the next 10 years and despite the costs of rebuilding Europe via the Marshall Plan and the Korean War, by the end of 1955, the federal debt only stood at $274.4 billion. Beginning in the early 60's, the shackles of fiscal restraint were gradually taken off and the buildup of the Vietnam War caused the federal debt to increase to $370.9 billion by the end of 1970. During the next decade, the growth in the federal debt accelerated and it stood at $914.3 billion by the end of 1980.
It took 125 years for the federal debt to reach $1 billion. It took another 43 years to reach $100 billion in WWII. It took 206 years for the federal debt to reach $1 trillion, and only four more years to reach $2 trillion. Clearly the debt was accelerating.
Second, wealth can only be created by mining, manufacturing, or use of natural resources.
During the past 50 years, this nation has ceased being a primary manufacturer of anything except agricultural, aviation, and technology products. Almost everything else is imported. This change has been mandated by depreciation and depletion policies which prevented our companies from writing off new capital equipment as quickly as foreign competitors, environmental regulations which have caused many industries to abandon the US, and trade policies which favored low-wage nations. The mentality of the consumer also played a large part in that low-price was more important than quality.
As a result, the US has seen its position as one of the largest creditor nations in the world at the end of the 1970's quickly disappear so that at the end of the 20th century we have become the largest debtor nation. And the only thing that has made it seem not so bad is that many citizens of other countries believe that the American dollar is safer than their own.
Shown below is a graph showing our net trade balance since 1900.
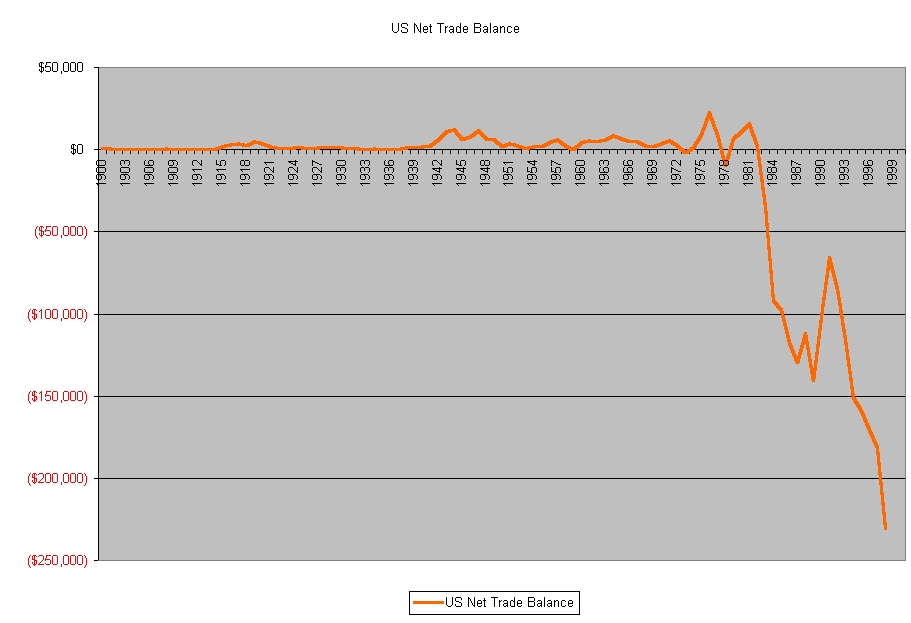
From Bureau of the Census data . . . Data is in Millions.
Note that the US had a trade surplus in almost every year during the 20th Century until 1973 when the first oil shock was encountered. But beginning in 1983 and continuing since the US has been importing more goods and services (including net foreign investment) than it has exported. This is a situation fraught with peril for confidence in the dollar.
The following graph shows the cumulative net trade surplus of the US since 1900.
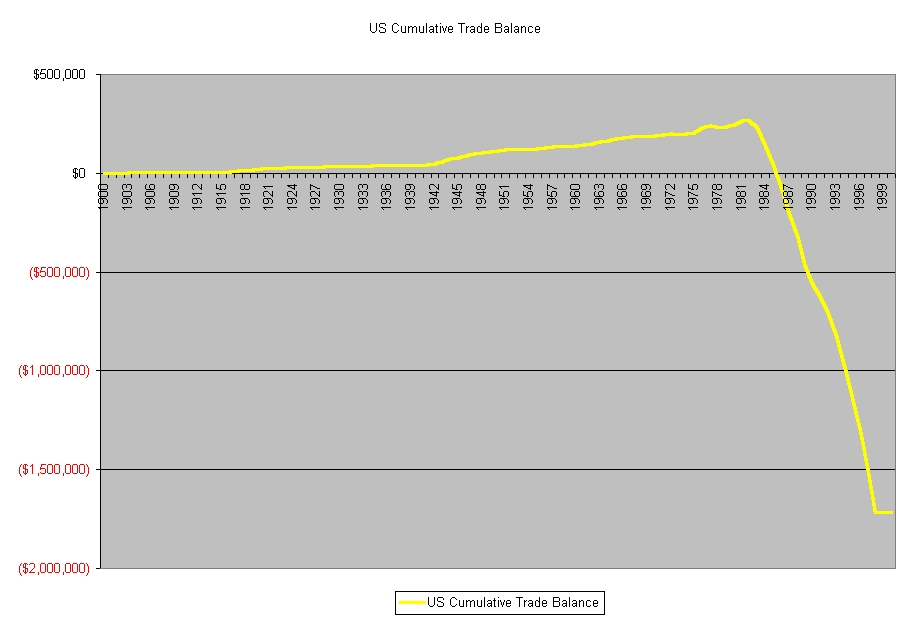
From the Bureau of the Census data.
Clearly, this US Cumulative Trade Balance cannot continue indefinitely without affecting world wide confidence in the US dollar. And when that goes, I hope that your wealth is not in cash and/or money market funds.
Third, those in power will do whatever is required to stay in power.
The Federal Reserve working in concert with the US Treasury attempts to juggle interest rates, M1, and M2 numbers to keep the economy moving without raising inflation greatly. To many US citizens, the memory of a prime rate of 22% during the Carter Administration has faded. Yet the M2 number has historically provided a better indication of the health of the American economy.
Shown below is the chart showing the M2 numbers since 1900.
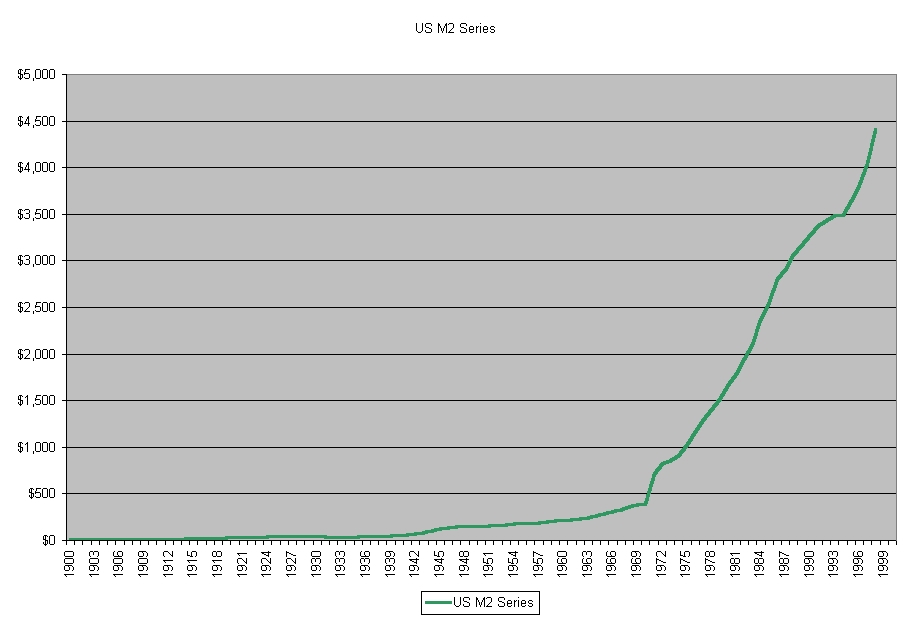
From the Bureau of the Census Data. Data is in Billions.
Notice how relatively flat the growth in M2 was until 1933 when President Roosevelt took the US off the Gold Standard. M2 grew at a relatively constant rate from 1933 until 1970 when it exploded and continues to rocket ahead as the Fed tries to supply enough liquidity to the markets to keep them moving ahead.
Of course, it is just paper! And if the experience of the German D-mark during the 1920's is any indication, at some point, it might only become John Wayne toilet paper . . . which is to say, "it is rough and tough, and don't take no S*** off an Indian." Could that be the reason why the money is being changed.
Fourth, where are we on the pendulum?
Clearly, stock prices on the NASDAQ exchange had increased during the past year by an amount that had no relationship to previous historical valuations. Even the Dow Jones stocks and the S&P 500 stocks were being valued at multiples of earnings never before seen.
The following chart shows the historic change in P/E multiples since 1950.
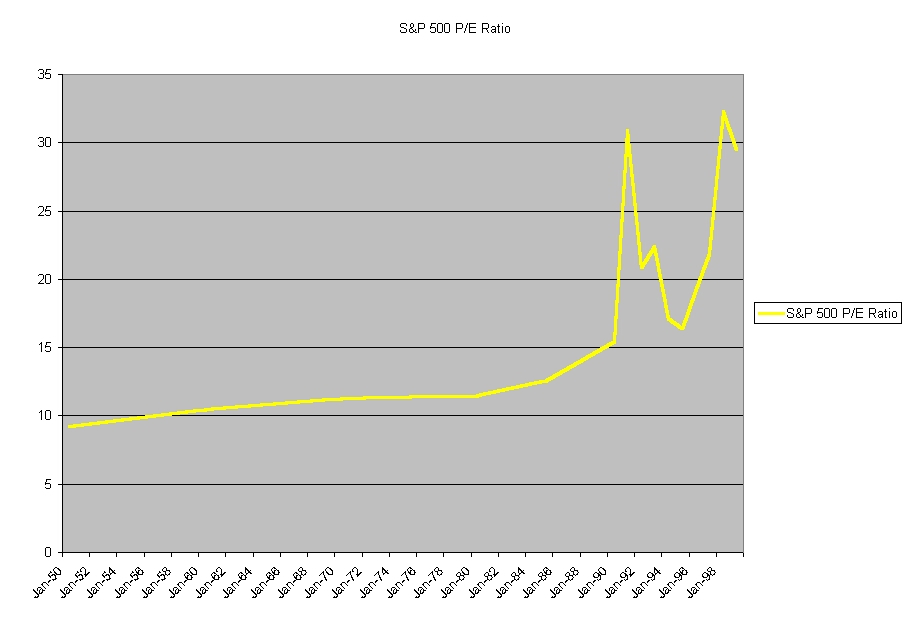
Historically until 1970, many fundamental analysts considered a range of 8-12 times projected earning to be in the ball park for valuation. Only in 1992 did the S&P 500 break the 15 P/E barrier. And in March 2000, the S&P 500 stood at over 30. If the P/E ratio returned to only 15, the S&P 500 would lose half its value.
According to Dr. Hidy, the pendulum is near its peak and about ready to slide down the slope to normal.
The last six weeks has since the NASDAQ average pull back from over 5,000 to 3,300 and then bounce back to the 3,800 level. The Dow Jones fell and has recovered most of its ground. But the major thing to me is that there is no market leadership. The market leaders for the past year have seen significant distribution occur and no sector has moved forward to dominate. That is a symptom of a market trying to decide if the bear has come or are we just treading water. Certainly, a lot of the excess valuations were squeezed out of many of the high-flying stocks.
It is interesting to note that prices for many of the internet and dot-com stocks without earnings have suffered the most from the NASDAQ slide. Whether this is a good time to increase your positions or to further lighten up is up for discussion. The momentum in the stock market has gone negative and when the panic set in it hit stocks irrespective of their earnings.
If you had followed our advice and maintained strict stop loss orders, you would probably be heavily in cash right now and facing some healthy taxes from those sales.
During the past three weeks, we have found only one stock that has met our stock screen out of the 15,000 stocks on the exchanges. That alone is significant! Be very cautious at this time.
First, test the water in the stock market slowly. Buy only quality stocks and be quick to exercise the stop loss.
Second, reduce debt levels as fast as possible.
Third, remember in an election year, the Federal Reserve will be trying to re-elect the Democratic party.
Fourth, stay tuned to developments and maintain or increase those Y2K precautions for food, water, and security.
That's it . .
But then - - 'Tis Only My Opinion!
Fred Richards
May 2000
This issue of 'Tis Only My Opinion was copyrighted by Adrich Corporation in May 2000.
All rights reserved. Quotation with attribution is encouraged.
Tis Only My Opinion is intended to provoke thinking, then dialogue among our readers.
![]()
![]() 'Tis Only My Opinion
Archive Menu
'Tis Only My Opinion
Archive Menu
Last updated - July 3, 2008